. 2013 Aug 14;14(2):195-206.
doi: 10.1016/j.chom.2013.07.012.

Fusobacterium nucleatum promotes colorectal carcinogenesis by modulating E-cadherin/β-catenin signaling via its FadA adhesin

Affiliations

Fusobacterium nucleatum promotes colorectal carcinogenesis by modulating E-cadherin/β-catenin signaling via its FadA adhesin

Mara Roxana Rubinstein et al. Cell Host Microbe. .

Abstract

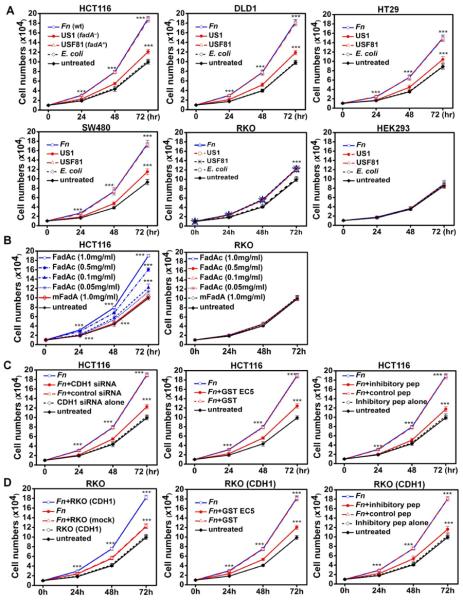
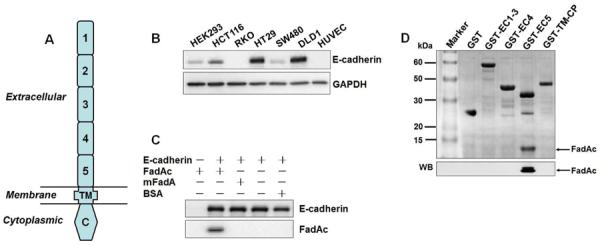
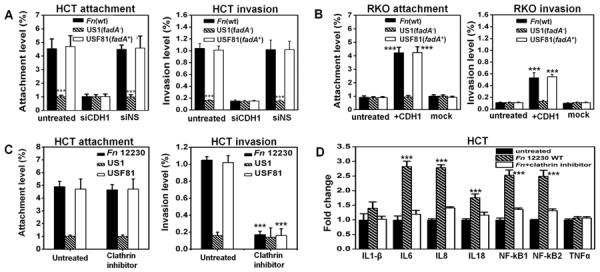
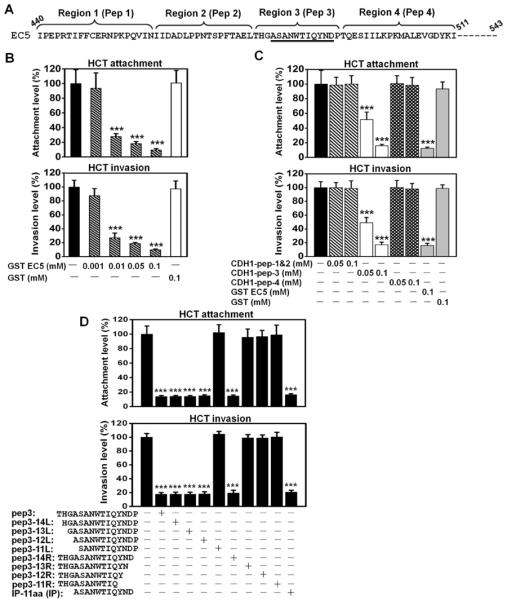
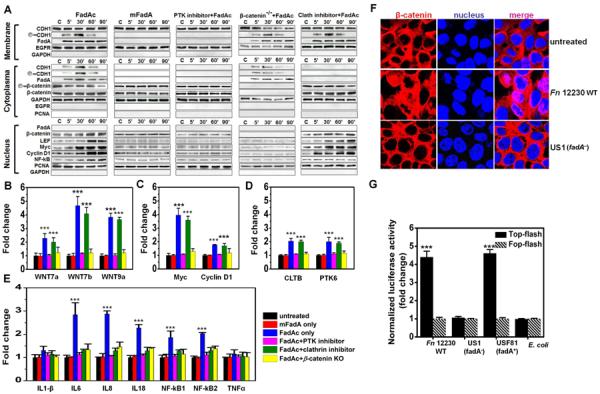
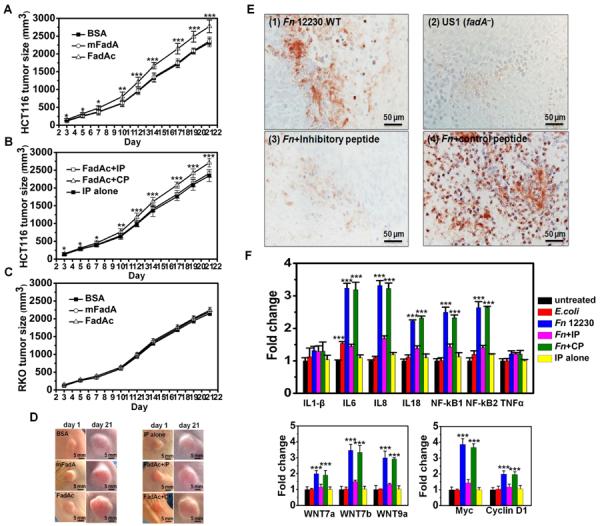
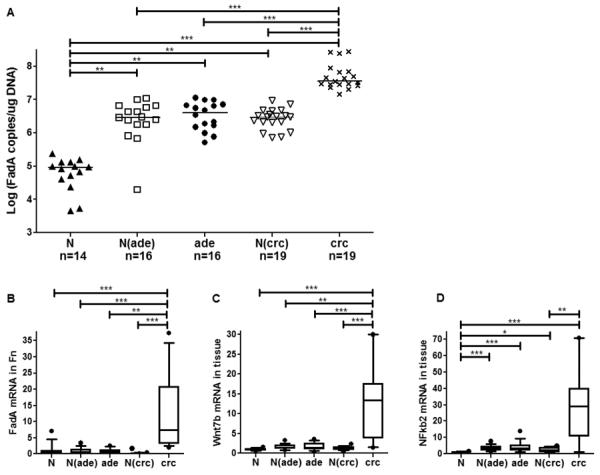
Fusobacterium nucleatum (Fn) has been associated with colorectal cancer (CRC), but causality and underlying mechanisms remain to be established. We demonstrate that Fn adheres to, invades, and induces oncogenic and inflammatory responses to stimulate growth of CRC cells through its unique FadA adhesin. FadA binds to E-cadherin, activates β-catenin signaling, and differentially regulates the inflammatory and oncogenic responses. The FadA-binding site on E-cadherin is mapped to an 11-amino-acid region. A synthetic peptide derived from this region of E-cadherin abolishes FadA-induced CRC cell growth and oncogenic and inflammatory responses. The fadA gene levels in the colon tissue from patients with adenomas and adenocarcinomas are >10-100 times higher compared to normal individuals. The increased FadA expression in CRC correlates with increased expression of oncogenic and inflammatory genes. This study unveils a mechanism by which Fn can drive CRC and identifies FadA as a potential diagnostic and therapeutic target for CRC.


Figures

Figure 1
Figure 1. Fn and FadA stimulate proliferation of human colon cancer cells via E-cadherin
A. Wild type Fn (Fn) and the fadA-complementing USF81 (fadA+) stimulated proliferation of human CRC cells HCT116, DLD1, SW480, and HT29, compared to untreated cells or those incubated with E. coli. US1 (fadA) only weakly stimulated their growth. Fn, USF81 and US1 all weakly stimulated the growth of CRC cells RKO, but not the non-CRC cells HEK293. B. Purified FadAc stimulated HCT116 cell growth in a dose-dependent manner, while mFadA did not. Neither FadAc nor mFadA stimulated RKO cell growth. C. Suppression of Fn-stimulated cell growth by inhibiting E-cadherin. Fn-stimulated HCT116 growth was inhibited by siRNA specific for CDH1, GST-EC5 fusion protein, and the inhibitory peptide (IP), but not by non-specific siRNA, GST, or the control peptide (CP). D. Fn stimulated the growth of RKO cells transfected with CDH1, but not mock-transfected RKO. Growth stimulation of CDH1-transfected RKO cells was suppressed by GST-EC5 and the inhibitory peptide, but not by GST or the control peptide. The results are presented as mean±SD. ***p<0.001. See also Figure S1.
Figure 2
Figure 2. E-cadherin is FadA receptor
A. Schematic representation of the E-cadherin (CDH1) structure. E-cadherin has five extracellular cadherin (ECs) repeats, numbered EC1–5 starting from N-terminal. TM, transmembrane domain; C, cytoplasmic domain. B. E-cadherin is expressed in epithelial cell HEK293 and most CRC cells. E-cadherin in HEK293 and human CRC cell lines HCT116, RKO, HT29, SW480 and DLD1 was examined by Western blot. Human umbilical vein endothelial cells (HUVEC) were included as a negative control. The endogenous GAPDH was used as a loading control. C. E-cadherin co-immunoprecipitates with FadAc. HEK293 cell lysate expressing E-cadherin was mixed with E. coli lysates expressing FadAc, or mFadA, or BSA, followed by incubation with mouse anti-CDH1 monoclonal antibodies (mAb) and captured with agarose A/G beads. E-cadherin and FadA in the bead elutes were detected by Western blot. D. FadA binds to EC5. Purified GST or GST-fusion proteins carrying EC1–3, EC4, or EC5 were incubated with E. coli lysates expressing FadAc, followed by capture with GST resin. The eluted components were subjected to SDS-PAGE, followed by Coommassie blue staining (top panel) and Western blot (WB) using anti-FadA mAb 5G11-3G8 (bottom panel). See also Figure S2.
Figure 3
Figure 3. Fn adheres to and invades E-cadherin-expressing CRC cells
A. Fn adheres to and invades the E-cadherin-expressing HCT116 via FadA and E-cadherin. The fadA-deletion mutant US1 (fadA) was defective for attachment and invasion, compared to wild type Fn and the fadA-complementing clone USF81 (fadA+). Transfection with siRNA to inhibit E-cadherin expression (siCDH1) reduced attachment and invasion, while the non-specific siRNA (siNS) did not. B. Wild-type Fn, US1, and USF81, were defective for attachment and invasion of the non-E-cadherin-expressing RKO cells. Transfection of full-length CDH1 into RKO enhanced attachment and invasion by wild type Fn and USF81 (fadA+), but not by US1 (fadA). C. The clathrin inhibitor, Pitstop2, inhibits Fn and USF81 (fadA+) invasion of HCT116, without affecting their attachment. D. Wild type Fn stimulates expression of NF-kappaB and pro-inflammatory cytokines IL-6, 8, and 18 in HCT116, which was inhibited by the clathrin inhibitor. Expression levels in untreated HCT116 were designated as “1”. For A, B, and D, the attachment and invasion levels were expressed as percent bacteria recovered from the host cells relative to the initial inoculum. For wild type Fn, these levels reflect recovering approximately 9000 CFU per well (in a 96-well plate) from the attachment assay and approximately 2000 CFU from the invasion assay. The invasion level of E. coli DH5a into HCT116 was <0.01%, i.e. < 20 CFU recovered per well (data not shown). For C, the original attachment (4.4±0.8%) and invasion (1.3±0.1%) levels without inhibition were designated as “100%”, and the relative inhibition values were shown. The results are presented as the mean±SD. ***p<0.001. See also Figure S3.
Figure 4
Figure 4. Identification of synthetic peptides to inhibit Fn attachment and invasion of HCT116 cells
A. Partial amino-acid sequence of the EC5 domain. The regions and the corresponding peptides (pep) are shown above the sequence. The sequences corresponding to the inhibitory peptide (IP, see below) are underlined. Peptide 4 was the control peptide (CP) in all studies. B. Purified GST-EC5 fusion protein inhibits wild type Fn attachment and invasion of HCT116 in a dose-dependent manner. C. Fn attachment and invasion of HCT116 cells were inhibited by a synthetic peptide corresponding to region 3 (pep 3) on the EC5 domain, not by peptides corresponding to regions1&2, or 4. D. The inhibitory effects of synthetic oligopeptides carrying sequential deletions from the N- and C-termini of region 3 on Fn attachment and invasion. Deletion of 3 residues from N-terminal and 1 residue form C-terminal did not affect the inhibitory function. An 11-aa peptide (ASANWTIQYND) was found as the minimum sequence required for inhibition of Fn attachment and invasion. All values were expressed as relative to those without inhibition, which were designated as “100%”. The actual attachment and invasion levels were 6.3±1.4% and 1.6±0.1%, respectively, for B, and 5.9±0.7% and 1.4±0.1%, respectively, for C. The results are presented as mean±SD. ***p<0.001.
Figure 5
Figure 5. FadAc activates E-cadherin-mediated cellular signaling
A. FadAc, but not mFadA, binds to the membranes of HCT116, accompanied by phosphorylation of E-cadherin on the membrane; internalization of E-cadherin and FadA, reduced phosphorylation of β-catenin, and accumulation of β-catenin in the cytoplasma; and translocation of β-catenin and activation of transcription factors lymphoid enhancer factor (LEF)/T-cell factor (TCF), NF kappaB, and oncogenes Myc and Cyclin D1 in the nuclei; all as detected by Western blot. Protein tyrosine kinase (PTK) inhibitor, Genistein, inhibits all FadAc-activated functions. No gene activation was detected in the HCT116 β-catenin−/− cells, despite binding and internalization of FadA and E-cadherin. The clathrin inhibitor, Pitstop2, prevented E-cadherin and FadA internalization and activation of NF kappaB, but did not affect nuclei translocation of β-catenin or expression of LEF/TCF, Myc or Cyclin D1. The epidermal growth factor receptor (EGFR), glyceraldehyde 3-phosphate dehydrogenase (GAPDH), and proliferating cell nuclear antigen (PCNA) were used as loading controls for membrane, cytoplasmic, and nucleus, respectively, and for examination for cross-contamination between the subcellular fractions. B–E. FadAc, but not mFadA or BSA, activates expression of Wnt signaling genes 7a, 7b, 9a (B), oncogenes Myc and Cyclin D1 (C), clathrin (cltb) and protein tyrosine kinase genes (ptk6) (D), and NF-kappaB and pro-inflammatory cytokines IL-6, 8, and 18 (E) in wild-type or β-catenin knockout HCT116 cells following 2 hrs incubation as determined by qPCR. The clathrin inhibitor inhibited expression of the inflammatory genes but not the Wnt or oncogenes, while inhibition of β-catenin by siRNA suppressed expression of all genes. Expression levels in untreated HCT116 were designated as “1”. F. Wild type Fn (Fn), but not US1 (fadA), induces nuclei translocation of β-catenin following 2 hrs incubation as observed by confocal microscopy. β-catenin was stained with Alex 634 (red) and the nuclei with 4',6-diamidino-2-phenylindole (DAPI) (blue). The purple color in the merged images indicates translocation of β-catenin into the nucleus. G. Luciferase reporter gene expression following HCT116 transfection with TOPFlash (activated by β-catenin) or FOPFlash (insensitive to β-catenin activation). Fn was incubated with the transfected cells at a MOI of 1,000:1 for 2 hours, followed by measurement of the luciferase activity. Values obtained with FOPFlash were designated as “1” and those obtained with TOPFlash were expressed as fold changes. Data are presented as mean fold changes ±SD of two independent experiments, each in triplicate. ***p<0.001.
Figure 6
Figure 6. FadA promotes E-cadherin-mediated CRC tumor growth and induction of pro-inflammatory cytokines in xenograft mice
HCT116 or RKO were injected subcutaneously and bilaterally into female nude mice, which were then randomized (5 per group) to receive treatments. A–C. FadAc stimulates HCT116 but not RKO xenograft growth. Purified FadAc, mFadA, or BSA were injected into xenografts of HCT116 either alone (A), or along with the inhibitory (IP) or control (CP) peptides (B), or RKO alone (C) in nude mice. IP alone is injected into HCT116 as a negative control (B). D. Representative tumors from A and B are shown. The first day of protein injection was designated as “day 1”. All tumors look the same on day 1. Notice the size increase of the tumor treated with FadAc and FadAc+CP on day 21, compared to other tumors on the same day. E. Immunohistochemical staining of xenografts infected with wild-type Fn (Fn), alone and with the inhibitory or control peptides, and the fadA-deletion mutant US1 (fadA) using rabbit anti-Fn polyclonal antibodies. For controls, xenografts infected with wild-type Fn was stained with pre-serum, and xenografts infected with E. coli DH5α were stained with anti-Fn antibodies (data not shown). F. Wild-type Fn induces expression of NF-kappaB and pro-inflammatory cytokines IL-6, 8, and 18; Wnt 7a, 7b, and 9a; and Myc and Cyclin D1 in HCT116 xenografts, as determined by qPCR. The inductions were inhibited by IP, but not by CP. E. coli only weakly induced IL-6. The results are presented as mean±SD. ***p<0.001. See also Figure S4.
Figure 7
Figure 7. Quantification of fadA gene copies and FadA, Wnt7b and NFkB2 expression in health, precancerous adenomas, and carcinomas
DNA and RNA were extracted from full-thickness colon specimens from the following 5 groups: (1) normal non-cancerous controls (N; n=14); (2) Normal tissues from patients with precancerous adenomas [N(ade); n=16]; (3) Precancerous adenomas (ade; n=16); (4) Normal tissues from patients with carcinomas [N(crc); n=19]; and (5) Carcinomas (crc; n=19). Gene copy numbers of fadA (A) were measured using DNA and determined using the standard curves. FadA mRNA levels in Fn were normalized to Fn 16 rRNA (B), and Wnt7b (C) and NFkb2 (D) mRNA levels were each normalized to the endogenous GAPDH. The average value of Group 1 (N) was designated “1”, and the fold changes of the other groups were determined by comparing to Group 1. The horizontal bars in a represent the median values. For B–D, the boxes show the 25/75 percentiles and the lines within the boxes the median values. Whiskers show the 10/90 percentiles. *p<0.05, **p<0.01 and *** p<0.001.

Comment in

References

    1. ACS Cancer Facts & Figures 2012. American Cancer Society (ACS) 2012:1–66.
    1. Arthur JC, Perez-Chanona E, Muhlbauer M, Tomkovich S, Uronis JM, Fan TJ, Campbell BJ, Abujamel T, Dogan B, Rogers AB, et al. Intestinal inflammation targets cancer-inducing activity of the microbiota. Science (New York, NY. 2012;338:120–123. - PMC - PubMed
    1. Baron JA, Sandler RS. Nonsteroidal anti-inflammatory drugs and cancer prevention. Annual review of medicine. 2000;51:511–523. - PubMed
    1. Bartlett DL, Chu E. Can metastatic colorectal cancer be cured? Oncology. 2012;26:266–275. - PubMed
    1. Bryant DM, Stow JL. The ins and outs of E-cadherin trafficking. Trends in cell biology. 2004;14:427–434. - PubMed

Publication types