. 2013 Aug 14;14(2):216-24.
doi: 10.1016/j.chom.2013.07.013.

A deficiency in the autophagy gene Atg16L1 enhances resistance to enteric bacterial infection

Affiliations

A deficiency in the autophagy gene Atg16L1 enhances resistance to enteric bacterial infection

Amanda M Marchiando et al. Cell Host Microbe. .

Abstract

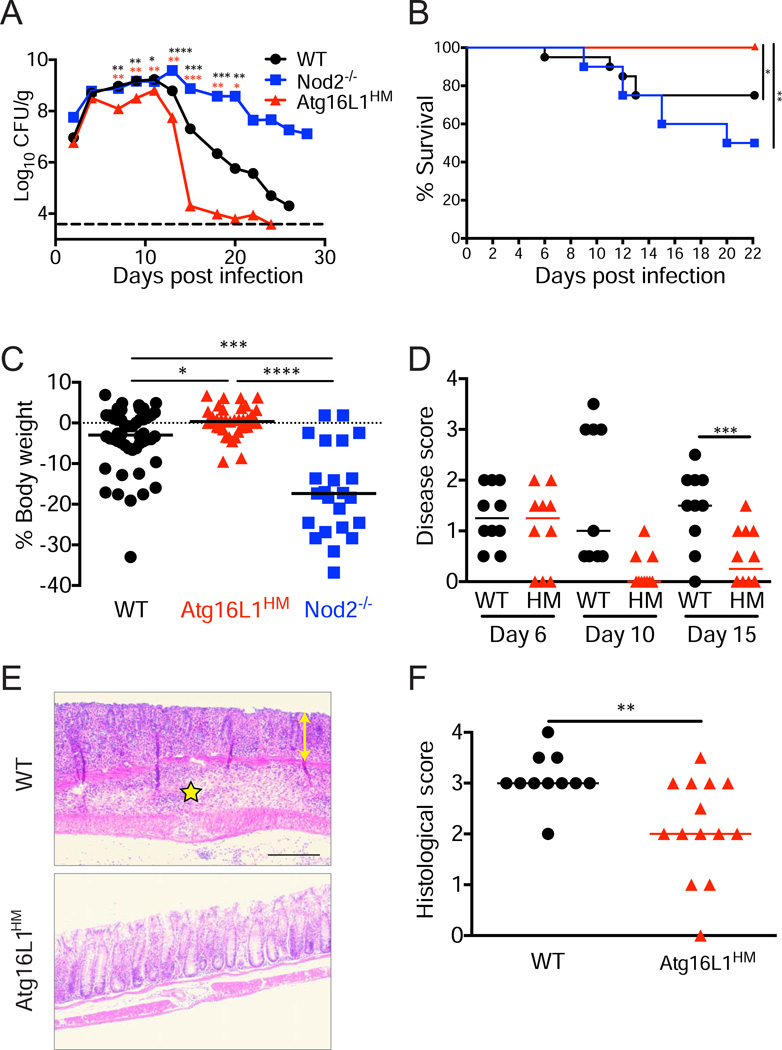
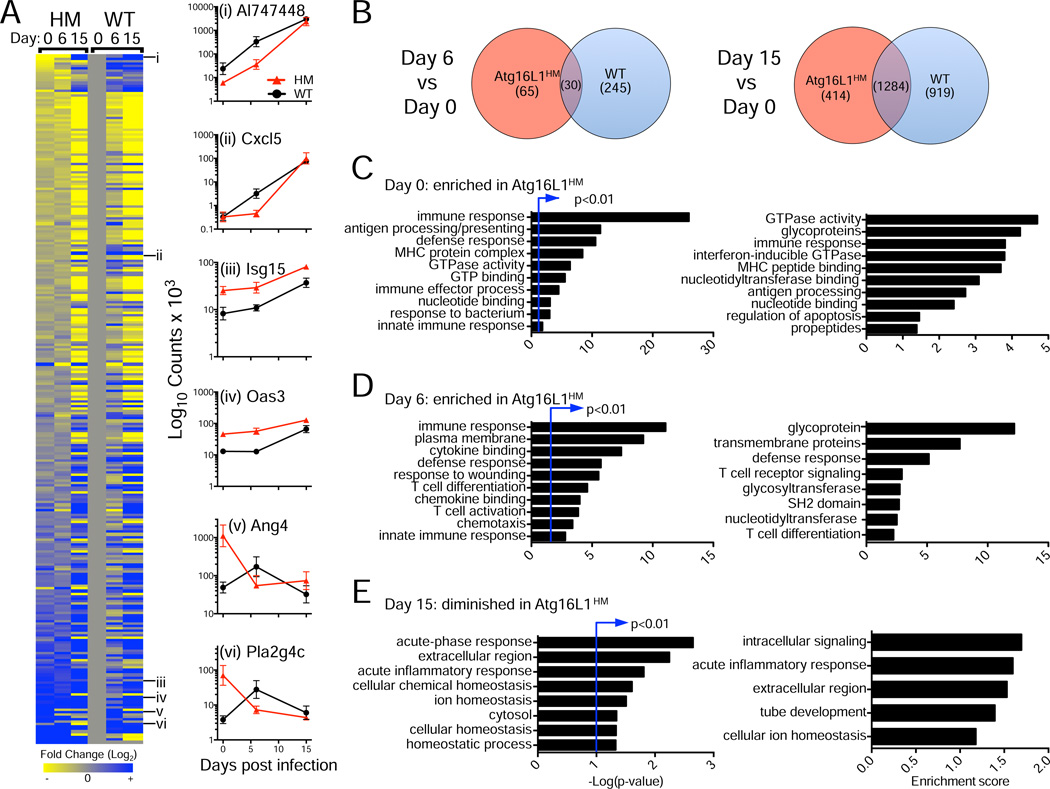
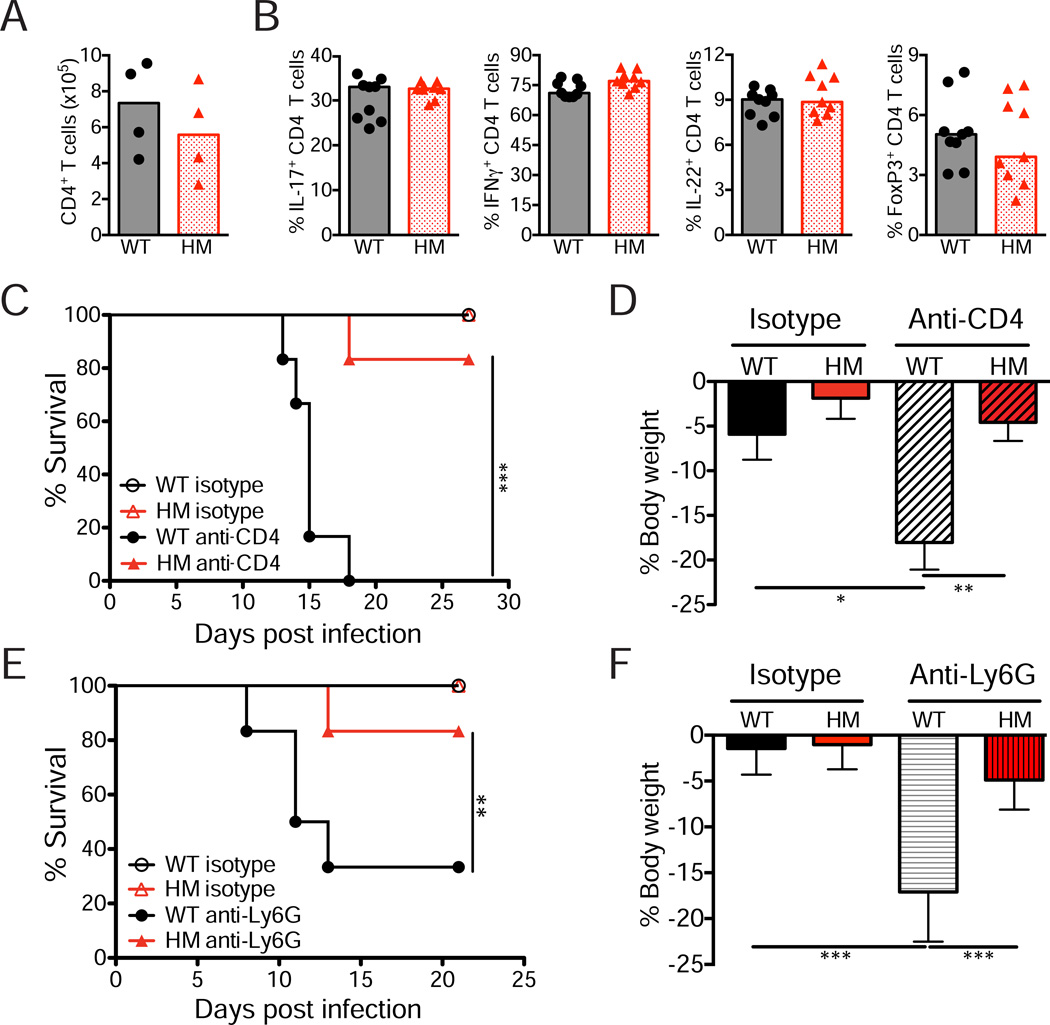
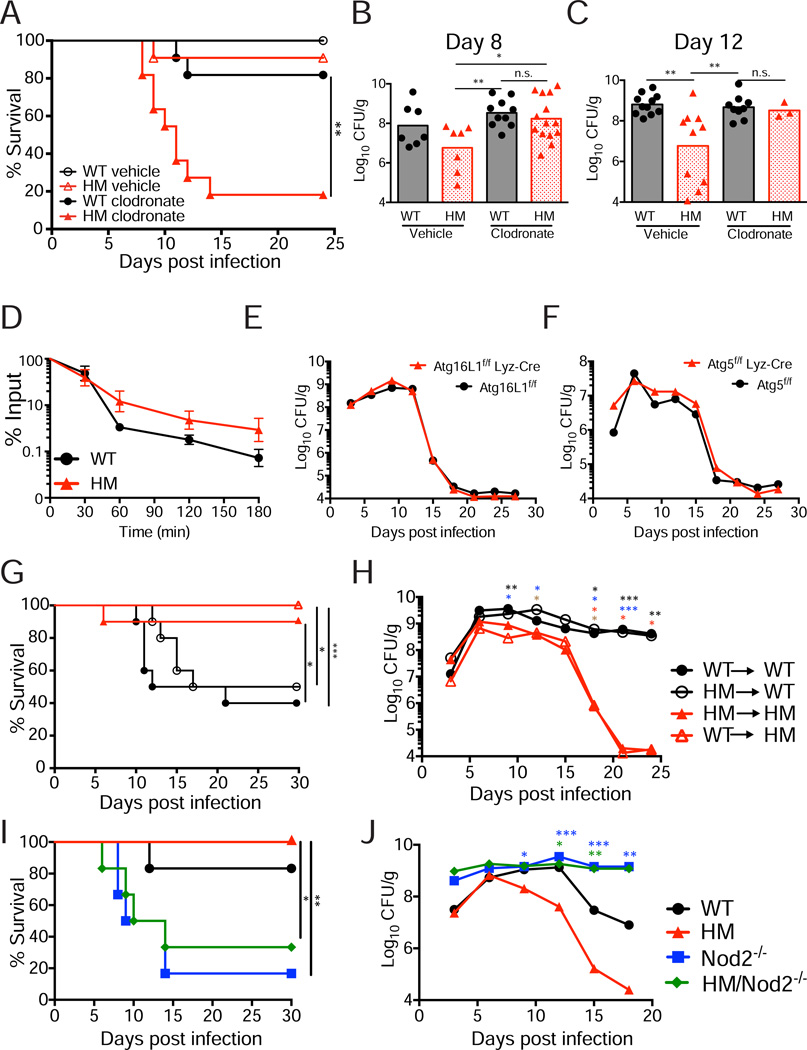
Polymorphisms in the essential autophagy gene Atg16L1 have been linked with susceptibility to Crohn's disease, a major type of inflammatory bowel disease (IBD). Although the inability to control intestinal bacteria is thought to underlie IBD, the role of Atg16L1 during extracellular intestinal bacterial infections has not been sufficiently examined and compared to the function of other IBD susceptibility genes, such as Nod2, which encodes a cytosolic bacterial sensor. We find that Atg16L1 mutant mice are resistant to intestinal disease induced by the model bacterial pathogen Citrobacter rodentium. An Atg16L1 deficiency alters the intestinal environment to mediate an enhanced immune response that is dependent on monocytic cells, but this hyperimmune phenotype and its protective effects are lost in Atg16L1/Nod2 double-mutant mice. These results reveal an immunosuppressive function of Atg16L1 and suggest that gene variants affecting the autophagy pathway may have been evolutionarily maintained to protect against certain life-threatening infections.


Figures

Figure 1
Figure 1. Atg16L1 mutant mice are resistant to C. rodentium
(A) Bacteria recovered from stool over time from WT, Atg16L1HM, and Nod2−/− mice inoculated with C. rodentium. Dashed line indicates limit of detection. n>10 mice/genotype. (B) Survival curve of infected mice. n=16–20 mice/genotype. (C) Quantification of weight change for mice in (B) on day 15 relative to initial body weight. (D) Quantification of disease for mice in (B) on indicated days. (E) Representative H+E-stained colonic sections on day 15. Yellow double-headed arrow denotes epithelial hyperplasia, crypt distortion, and goblet cell depletion; and yellow star indicates region with marked intramural edema and inflammatory infiltrates that focally extend into the muscularis and serosal surface. Scale bar=100 µm. (F) Quantification of pathologies observed in colon. n=11–14 mice/genotype. Data points in (A) and bars in (C) represent median. Bars in (D) and (F) represent mean. *p<0.05, **p<0.01, ***p<0.001, ****p<0.0001. Red and black asterisks in (A) denote significant differences when comparing Atg16L1HM to WT and Nod2−/− respectively. See also Figure S1
Figure 2
Figure 2. Atg16L1 deficiency is associated with a hyper-immune transcriptional response in the intestine
(A) RNA-Seq analysis of whole colonic tissue from WT and Atg16L1HM mice on day 0, 6, and 15 post-infection. Heat map displays ratio of normalized expression values of genes associated with immune responses for each sample vs WT on day 0. Right panels show examples of patterns in which expression is induced in both WT and Atg16L1HM (i, ii); elevated in uninfected Atg16L1HM and remain high (iii, iv); and elevated initially in uninfected Atg16L1HM but induced in WT after infection (v, vi). Data is shown as counts of RNA base pairs, mean+/−SEM. (B) Venn diagram showing number of genes that display increased expression on day 6 or 15 in Atg16L1HM, WT, or both compared to day 0 samples of the same genotype. (C) Gene ontology (GO) analysis of transcripts enriched in Atg16L1HM compared to WT on day 0. (D) GO analysis of transcripts enriched in Atg16L1HM compared to WT on day 6. (E) GO analysis of transcripts enriched in WT compared to Atg16L1HM on day 15. GO terms with the highest significance (left) and enrichment (right) are shown for (C), (D), and (E). See also Table S1.
Figure 3
Figure 3. Protection conferred by Atg16L1 deficiency is independent of the T helper cell and neutrophil responses
(A) Quantification by flow cytometry of the total number of CD4+ T cells (CD4+ TCRβ+) in the colonic lamina propria on day 15 post-infection. n=4 mice/genotype. (B) Quantification of the proportion of CD4+ T cells expressing the indicated differentiation markers after PMA/ionomycin treatment. n=9 mice/genotype. (C) Survival curve of infected WT and Atg16L1HM mice injected with anti-CD4 or isotype control antibodies. n=6 mice/condition. (D) Quantification of weight change observed in mice from (C) on day 13 relative to initial body weight. (E) Survival curve of infected WT and Atg16L1HM mice injected with anti-Ly6G or isotype control antibodies. n=6 mice/group. (F) Quantification of weight change observed in mice from (E) on day 8 relative to initial body weight. Bars in (A), (B), (D), and (F) represent mean. Error bars in (D) and (F) represent SEM. *p<0.05, **p<0.01, ***p<0.001. See also Figure S2.
Figure 4
Figure 4. Resistance to C. rodentium in Atg16L1 mutant mice is dependent on monocytes and Nod2
(A) Survival curve of infected WT and Atg16L1HM mice injected with clodronate liposomes or liposomes only (vehicle control). n=11 mice/group. (B) Quantification of bacteria in stool from mice in (A) on day 8 post-infection. (C) Quantification of bacteria in stool from surviving mice in (A) on day 12. (D) C. rodentium was incubated with WT and Atg16L1HM peritoneal macrophages and internalized bacteria were recovered at indicated time points after incubation. Average of 3 experiments, n=6 mice/genotype (2 per experiment). (E) Quantification of bacteria recovered from stool over time from Atg16L1f/f and Atg16L1f/fLyz-Cre mice inoculated with C. rodentium. n=7 Atg16L1f/f and 14 Atg16L1f/fLyz-Cre mice. (F) Quantification of bacteria recovered from stool over time from Atg5f/f and Atg5f/fLyz-Cre mice inoculated with C. rodentium. n=13 Atg5f/f and 11 Atg5f/fLyz-Cre mice. (G) Survival curve of chimeric mice inoculated with C. rodentium. n=10 mice/group. (H) Quantification of bacteria recovered from stool over time from the mice in (G). (I) Survival curve of WT, Atg16L1HM, Nod2−/−, and Atg16L1HM/Nod2−/− mice inoculated with C. rodentium. n≥5 mice/genotype. (J) Quantification of bacteria from stool over time from the mice in (I). Bars in (B) and (C) and data points in (E), (F), (H), and (J) represent median. Data points in (D) represent mean+/−SEM. *p<0.05, **p<0.01, ***p<0.001. Asterisks in (H) denote significant differences comparing: WT→WT vs WT→HM (black), HM→WT vs WT→HM (blue), WT→WT vs HM→HM (red), and HM→WT vs HM→HM (brown). Blue and green asterisks in (J) denote Atg16L1HM compared to Nod2−/− and Atg16L1HM/Nod2−/− respectively. See also Figure S3.

References

    1. Asseman C, Read S, Powrie F. Colitogenic Th1 cells are present in the antigen-experienced T cell pool in normal mice: control by CD4+ regulatory T cells and IL-10. Journal of immunology. 2003;171:971–978. - PubMed
    1. Benjamin JL, Sumpter R, Jr, Levine B, Hooper LV. Intestinal Epithelial Autophagy Is Essential for Host Defense against Invasive Bacteria. Cell Host Microbe. 2013;13:723–734. - PMC - PubMed
    1. Bry L, Brigl M, Brenner MB. CD4+-T-cell effector functions and costimulatory requirements essential for surviving mucosal infection with Citrobacter rodentium. Infection and immunity. 2006;74:673–681. - PMC - PubMed
    1. Cadwell K, Liu JY, Brown SL, Miyoshi H, Loh J, Lennerz JK, Kishi C, Kc W, Carrero JA, Hunt S, et al. A key role for autophagy and the autophagy gene Atg16l1 in mouse and human intestinal Paneth cells. Nature. 2008;456:259–263. - PMC - PubMed
    1. Cadwell K, Patel KK, Maloney NS, Liu TC, Ng AC, Storer CE, Head RD, Xavier R, Stappenbeck TS, Virgin HW. Virus-plus-susceptibility gene interaction determines Crohn's disease gene Atg16L1 phenotypes in intestine. Cell. 2010;141:1135–1145. - PMC - PubMed

Publication types

Associated data