. 2013 Aug 29;154(5):1085-1099.
doi: 10.1016/j.cell.2013.07.035. Epub 2013 Aug 15.

Beclin 2 functions in autophagy, degradation of G protein-coupled receptors, and metabolism

Affiliations

Beclin 2 functions in autophagy, degradation of G protein-coupled receptors, and metabolism

Congcong He et al. Cell. .

Abstract

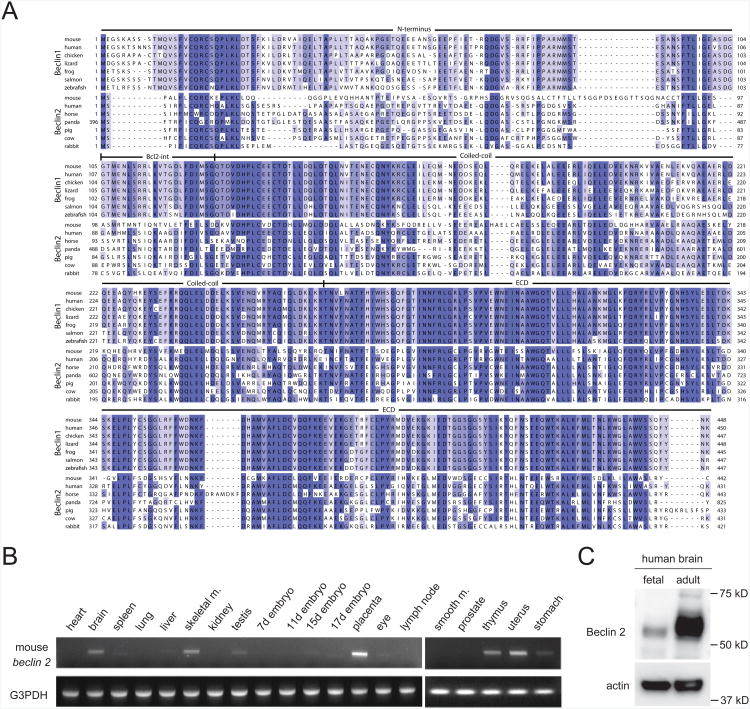
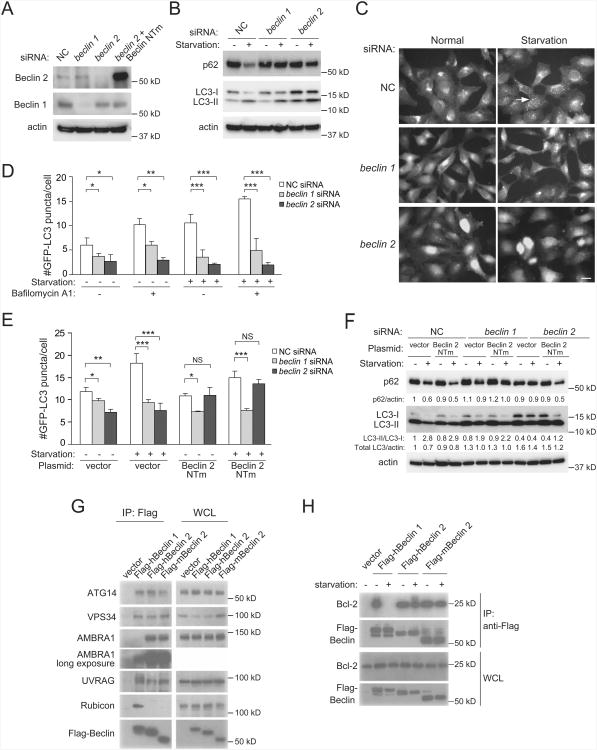
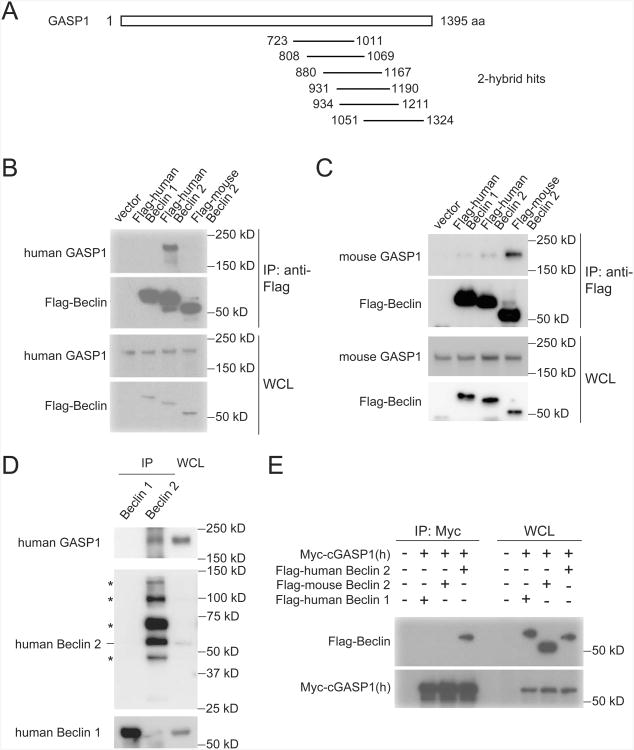
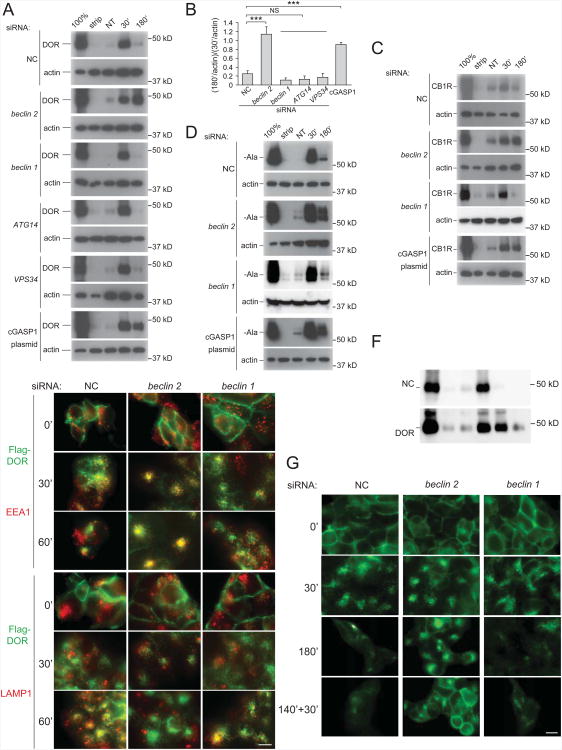
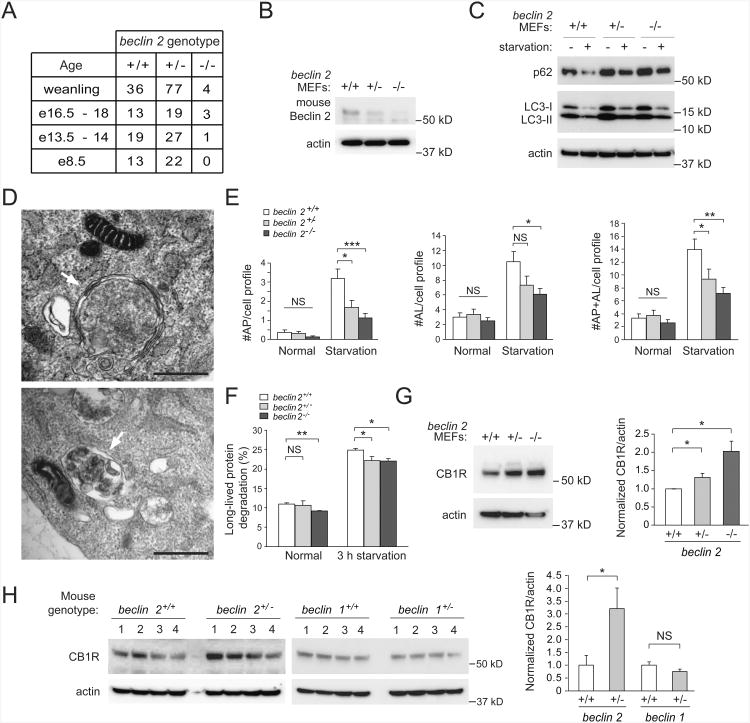
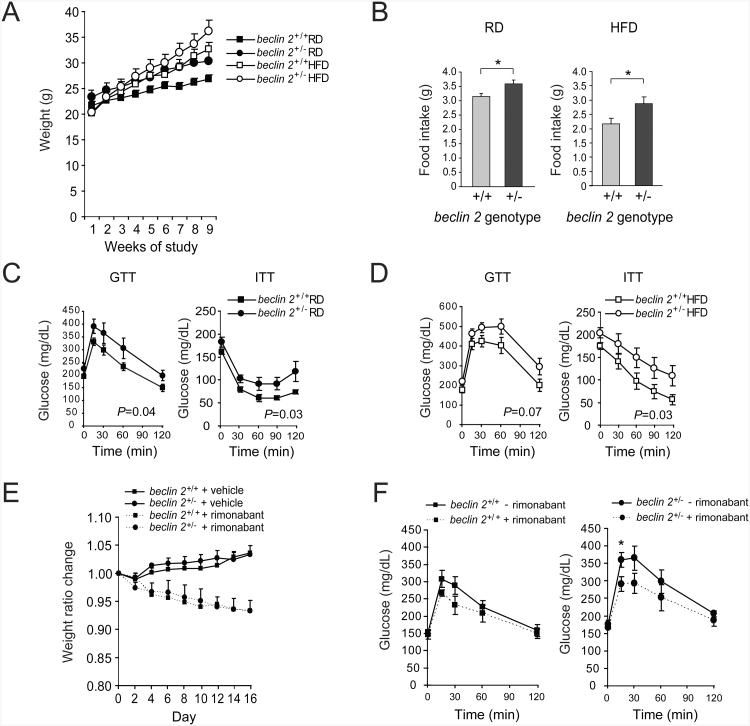
The molecular mechanism of autophagy and its relationship to other lysosomal degradation pathways remain incompletely understood. Here, we identified a previously uncharacterized mammalian-specific protein, Beclin 2, which, like Beclin 1, functions in autophagy and interacts with class III PI3K complex components and Bcl-2. However, Beclin 2, but not Beclin 1, functions in an additional lysosomal degradation pathway. Beclin 2 is required for ligand-induced endolysosomal degradation of several G protein-coupled receptors (GPCRs) through its interaction with GASP1. Beclin 2 homozygous knockout mice have decreased embryonic viability, and heterozygous knockout mice have defective autophagy, increased levels of brain cannabinoid 1 receptor, elevated food intake, and obesity and insulin resistance. Our findings identify Beclin 2 as a converging regulator of autophagy and GPCR turnover and highlight the functional and mechanistic diversity of Beclin family members in autophagy, endolysosomal trafficking, and metabolism.


Figures

Figure 1
Figure 1. Sequence alignment and expression pattern of Beclin 2
(A) Alignment of Beclin 2 and Beclin 1 sequences. Shown are all known Beclin 2sequences, Beclin 1 sequences from selected mammalian organisms possessing Beclin 2,and Beclin 1 sequences from non-mammalian vertebrates whose genomes apparentlyencode only Beclin 1. See also Figure S1. (B) RT-PCR analysis of mouse beclin 2 expression level in different tissues using cDNA from a pool of approximately 200 mice. (C) Western blot detection of human Beclin 2 in fetal and adult human brain lysates.
Figure 2
Figure 2. Beclin 2 functions in autophagy and interacts with known Beclin 1 binding partners
(A) Western blot detection of Beclin 1 and Beclin 2 in HeLa cells transfected with indicated siRNA. Beclin 2 NTm, an siRNA non-targetable mutant beclin 2 rescue plasmid. (B) Western blot detection of p62 and LC3 in HeLa cells transfected with indicated siRNA during growth in normal medium (starvation “−”) or after 3 h amino acid and serum starvation (starvation “+”). See Figure S2B for quantitative analysis of western blots from three independent experiments. (C) Representative images of GFP-LC3 puncta in HeLa/GFP-LC3 cells transfected with indicated siRNA and cultured for 3 h in normal or starvation medium. Arrow, representative autophagosome. Scale bar, 20 μm. (D) Quantification of GFP-LC3 puncta in HeLa/GFP-LC3 cells transfected with indicated siRNA, treated with 100 nM bafilomycin A1 or vehicle (DMSO), and cultured for 3 h in normal or starvation medium. (E) Quantification of GFP-LC3 puncta in HeLa/GFP-LC3 cells cotransfected with indicated siRNA and indicated plasmid, and cultured for 3 h in normal or starvation medium. (F) Western blot detection of p62 in HeLa cells cotransfected with indicated siRNA andindicated plasmid, and cultured for 3 h in normal or starvation medium. Quantification ofrelative levels of p62/actin, LC3-II/LC3-I and total LC3/actin is shown below each gellane. (G) Co-immunoprecipitation of class III PI3K complex components with indicated Beclinproteins in HeLa cells transfected with indicated Flag-Beclin plasmids using an anti-Flagantibody. (H) Co-immunoprecipitation of Bcl-2 with indicated Beclin proteins in HeLa cells transfected with indicated Flag-Beclin constructs using an anti-Flag antibody in nutrient-rich conditions or after 3 h of starvation. For (D) and (E), bars represent mean represent mean ± SEM of triplicate samples (∼50 cells per sample) and similar results were observed in three independent experiments. *P<0.05; **P<0.01; ***P<0.001; NS, not significant; ANOVA with Dunnett method. NC, non-silencing control; WCL, whole cell lysate. See also Figure S2.
Figure 3
Figure 3. GASP1 is an interaction partner of Beclin 2
(A) Schematic depicting hits (14 colonies encoding proteins mapping to indicated amino acids of GASP1) isolated from yeast two-hybrid screen of human brain cDNA library using N-terminal human Beclin 2 (amino acids 1-88) as bait. (B) Co-immunoprecipitation of endogenous human GASP1 with human Flag-Beclin 2 in HEK293 cells transfected with indicated plasmids. (C) Co-immunoprecipitation of endogenous mouse GASP1 with mouse Flag-Beclin 2 in mouse Neuro2A cells transfected with indicated plasmids. (D) Co-immunoprecipitation of endogenous GASP1 with endogenous Beclin 2 inHEK293 cells. Asterisks denote non-specific bands. (E) Co-immunoprecipitation of Flag-human Beclin 2 with Myc-tagged C-terminal humanGASP1 in HeLa cells transfected with indicated plasmids. cGASP1, C-terminal GASP1. See also Figure S3.
Figure 4
Figure 4. Beclin 2 is required for degradation of a subset of GPCRs
(A, C, D) Effects of indicated siRNA or cGASP1 overexpression on biotin-mediated protection of (A) the DOR after agonist treatment (DADLE, 5 μM) in HEK293 cells stably expressing Flag-DOR, (C) the CB1R after agonist treatment (WN 55,212-1 μM) in HEK293 cells stably expressing Flag-CB1R, and (D) the β-Ala receptor after agonist treatment (isoproterenol, 5 μM) in HEK293 cells stably expressing Flag-β-Ala. For (A, C, D), first lane (100%) represents total biotinylated GPCR prior to cell surface biotin stripping; second lane (strip) represents the remaining biotinylated GPCR after cell surface stripping; third lane (NT) represents the level of internalized biotinylated receptor with vehicle treatment after stripping; fourth and fifth lanes (30′, 180′) represent levels of internalized biotinylated receptor with agonist treatment for 30 min or 180 min, respectively, after stripping. Biotinylated Flag epitope-tagged GPCRs were precipitated with anti-Flag antibody, analyzed by SDS-PAGE, and detected with streptavidin overlay. (B) Quantification of the ratio of DOR levels at 180 min versus 30 min in each condition shown in (A). Bars represent mean ± SEM of three independent experiments. ***P<0.001; NS, not significant; ANOVA with Dunnett method. (E) Fluorescent microscopic imaging of DOR in HEK293 cells stably expressing Flag-DOR treated with indicated siRNAs. Cells were fed with anti-Flag antibody, treated with the agonist for 30 or 60 min, immunostained with anti-EEA1 or anti-LAMP1 primary antibodies, and labeled with fluorescent secondary antibodies. Green, Flag-DOR; red, EEA1 or LAMP1. Scale bar, 10 μm. (F) Effects of indicated siRNA on DOR recycling to the cell surface. HEK293/Flag-DORcells were treated with agonist for 30 min or 180 min as in (A), or in lane 6, treated withagonist for 140 min, antagonist for 30 min, and then subjected to stripping of cell surfacebiotin. (G) Immunofluorescence analysis of effects of indicated siRNA on fate of cell surface-labeled Flag-DOR. HEK293/Flag-DOR were incubated with anti-Flag antibody, and then treated as in (F) (except without membrane stripping). Subcellular localization of Flag-DOR was detected by immunofluorescent staining. Scale bar, 10 μm. See also Figure S4.
Figure 5
Figure 5. The Beclin 2-GASP1 interaction is essential for GPCR degradation but not autophagy
(A) Co-immunoprecipitation of endogenous GASP1 in HEK293 cells transfected with indicated Flag epitope-tagged Beclin constructs. (B) Alignment of amino acids 69-88 of Beclin 2 and Beclin 1 family members. Red arrow denotes position of Beclin 2 I80 residue. (C) Co-immnoprecipitation of endogenous GASP1 in HEK293 cells transfected with indicated Flag epitope-tagged wild-type (WT) or mutant Beclin 2 constructs. (D) Expression of Beclin 2 in HEK293 cells co-transfected with beclin 2 siRNA and indicated Beclin 2 NTm rescue plasmids. (E) Effects of beclin 2 siRNA and indicated plasmid co-transfection on biotin-mediatedprotection of the DOR after agonist treatment (DADLE, 5 μM) in HEK293/Flag-DORcells. (F) Quantification of the ratio of DOR levels at 180 min versus 30 min in each conditionshown in (E). Bars represent mean ± SEM of three independent experiments. (G) Representative images of GFP-LC3 puncta in HeLa/GFP-LC3 cells after co-transfection with beclin 2 siRNA and indicated plasmid and culture for 3 h in normal or starvation medium. Arrows denote representative autophagosomes. Scale bar, 20 μm. (H) Quantification of the GFP-LC3 puncta shown in (G). Bars represent mean ± SEM of triplicate samples (∼50 cells per sample). Similar results observed in three independent experiments. *P<0.05; **P<0.01; ***P<0.001; NS, not significant; ANOVA with Dunnett method. See also Figure S5.
Figure 6
Figure 6. Role of endogenous mouse beclin 2 in autophagy and regulation of CB1R levels
(A) Genotype distribution of offspring from beclin 2+/− intercrosses at indicated ages. (B) Western blot detection of Beclin 2 in MEFs of indicated genotype. (C) Western blot detection of p62 and LC3 in MEFs of indicated genotype during growth in normal medium (starvation “−”) or after 3 h amino acid and serum starvation (starvation “+”). See Figure S6D for quantitative analysis of western blots from three independent experiments. (D) Representative electron microscopic image of an autophagosome (arrow, upper panel) and an autolysosome (arrow, lower panel) in beclin 2+/+ MEFs cultured for 3 h in starvation medium. Scale bars, 500 nm. (E) Electron microscopic quantification of autophagosomes (AP) and autolysosomes (AL)in MEFs of indicated genotype cultured for 3 h in normal or starvation medium. Resultsrepresent mean ± SEM of 25 random cell profiles per experimental group. (F) Long-lived radiolabeled cellular protein degradation in MEFs of indicated genotypecultured for 3 h in normal or starvation medium. Bars represent mean ± SEM of threeindependent experiments. (G) Western blot detection of CB1R in MEFs of indicated genotype. Quantification of normalized levels of CB1R is shown on right. Bars represent mean ± SEM of three independent experiments. For (E-G), *P<0.05; **P<0.01; ***P<0.001; NS, not significant; ANOVA with Dunnett Method. (H) Western blot detection of CB1R in whole brain lysates from mice of indicated genotype. Quantification of normalized levels of CB1R is shown on right. Bars represent mean ± SEM of four mice in each genotype. *P<0.05; NS, not significant; ANOVA See also Figure S6.
Figure 7
Figure 7. beclin 2 heterozygous knockout mice develop increased body weight and insulin resistance
(A) Weekly weights of 8 week-old littermate mice of indicated genotype during 8 weeks of regular diet (RD) or high-fat diet (HFD) treatment. P<0.001 for beclin 2+/+ versus beclin 2+/− in both RD and HFD conditions; linear mixed effect model. (B) Daily food intake of littermate mice of indicated genotype at the end of 8 weeks of RD or HFD treatment. *P<0.05; ANOVA. (C and D) Glucose tolerance tests and insulin tolerance tests performed on littermate mice of indicated genotype after 8 weeks RD (C) or HFD (D) treatment. P values in each graph represent the difference between two curves; see methods for details of statistical analysis. For (A-D), results represent mean ± SEM for 6-8 mice per experimental group. (E) Weight ratio changes of 8 week-old littermate mice of indicated genotypes fed with RD during 16 days of daily intraperitoneal rimonabant (10 mg kg−1) or vehicle control treatment. Both genotypes had similar weight ratio changes with rimonabant; P=NS; linear mixed effect model. (F) Glucose tolerance tests on littermate mice of indicated genotypes fed with RD before and after 16 days of daily intraperitoneal rimonabant treatment. *P<0.05 for comparison of glucose value between two groups at indicated time point; ANOVA. For (E-F), results represent mean ± SEM for 5 mice per group. See also Figure S7.

Comment in

Similar articles

Cited by

References

    1. Abu-Helo A, Simonin F. Identification and biological significance of G protein-coupled receptor associated sorting proteins (GASPs) Pharmacol Ther. 2010;126:244–250. - PubMed
    1. Aissani B, Perusse L, Lapointe G, Chagnon YC, Bouchard L, Walts B, Bouchard C. A quantitative trait locus for body fat on chromosome 1q43 in French Canadians: linkage and association studies. Obesity (Silver Spring) 2006;14:1605–1615. - PubMed
    1. Bosse Y, Chagnon YC, Despres JP, Rice T, Rao DC, Bouchard C, Perusse L, Vohl MC. Genome-wide linkage scan reveals multiple susceptibility loci influencing lipid and lipoprotein levels in the Quebec Family Study. J Lipid Res. 2004;45:419–426. - PubMed
    1. Chen Y, Klionsky DJ. The regulation of autophagy - unanswered questions. J Cell Sci. 2011;124:161–170. - PMC - PubMed
    1. Cota D, Marsicano G, Tschop M, Grubler Y, Flachskamm C, Schubert M, Auer D, Yassouridis A, Thone-Reineke C, Ortmann S, et al. The endogenous cannabinoid system affects energy balance via central orexigenic drive and peripheral lipogenesis. J Clin Invest. 2003;112:423–431. - PMC - PubMed

Publication types

MeSH terms

Associated data