. 2013 Sep 9;23(17):1691-5.
doi: 10.1016/j.cub.2013.07.007. Epub 2013 Aug 15.

Microscopic eye movements compensate for nonhomogeneous vision within the fovea

Affiliations

Microscopic eye movements compensate for nonhomogeneous vision within the fovea

Martina Poletti et al. Curr Biol. .

Abstract

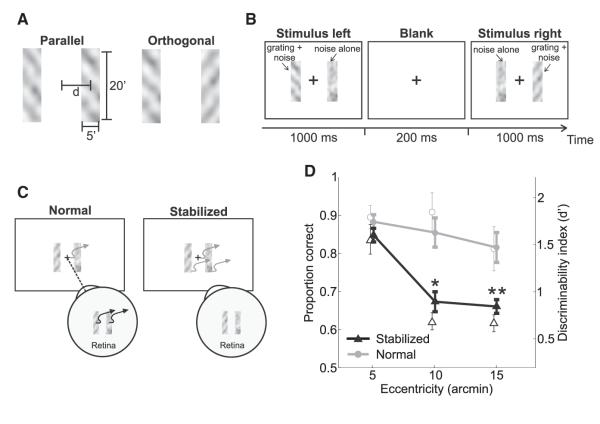
Humans rely on the fovea, the small region of the retina where receptors are most densely packed, for seeing fine spatial detail. Outside the fovea, it is well established that a variety of visual functions progressively decline with eccentricity. In contrast, little is known about how vision varies within the central fovea, as incessant microscopic eye movements prevent isolation of adjacent foveal locations. Using a new method for restricting visual stimulation to a selected retinal region, we examined the discrimination of fine patterns at different eccentricities within the foveola. We show that high-acuity judgments are impaired when stimuli are presented just a few arcminutes away from the preferred retinal locus of fixation. Furthermore, we show that this dependence on eccentricity is normally counterbalanced by the occurrence of precisely directed microsaccades, which bring the preferred fixation locus onto the stimulus. Thus, contrary to common assumptions, vision is not uniform within the foveola, but targeted microscopic eye movements compensate for this lack of homogeneity. Our results reveal that microsaccades, like larger saccades, enable examination of the stimulus at a finer level of detail and suggest that a reduced precision in oculomotor control may be responsible for the visual acuity impairments observed in various disorders.


Figures

Figure 1
Figure 1
Experimental Procedure and Results (A) In a forced-choice task, subjects reported whether two gratings (11 cycles/degree tilted by ±45°) were parallel or orthogonal. (B) Gratings appeared within two rectangular noise bars centered at the desired eccentricity d. They were displayed sequentially first in the left and then in the right bar while subjects maintained fixation at the center of the display (cross). (C) Stimuli were either displayed at fixed positions on the screen (normal) and normally moved on the retina because of fixational eye movements or at fixed locations on the retina (stabilized) and moved on the display under computer control to compensate for the subject’s eye movements. (D) Average subject performance (n = 4) as a function of the stimulus eccentricity in the two conditions. Both proportions of correct responses (filled symbols) and d’ values (empty symbols) are shown. In each condition, asterisks mark statistically significant differences with respect to the proportions of correct responses at 5′ (*p < 0.05; **p < 0.005; two-tailed paired t test). Error bars represent SEM. See also Figures S1 and S2.
Figure 2
Figure 2
Gaze Location in Normal, Unstabilized Trials (A) Examples of fixational eye movements. Red and blue segments represent microsaccades and drifts, respectively. (B) Average horizontal position of the center of gaze during presentation of each of the two gratings. In both (A) and (B), different panels show data obtained with stimuli at different eccentricities. Error bars represent SEM. Asterisks mark significant differences (p < 0.05; two-tailed paired t test). The center of gaze is defined in this study as the point on the screen projecting onto the center of the preferred retinal locus of fixation. This point was estimated by means of a preliminary calibration procedure, in which the observer maintained prolonged fixation on markers at known positions on the display. See also Figure S3 and Movies S1, S2, and S3.
Figure 3
Figure 3
Microsaccades and Gaze Position in the Normal Condition (A) Proportions of microsaccades landing on one of the two bars and on the background region during the two periods of grating presentation. Microsaccades were more likely to relocate the preferred retinal locus of fixation on the bar currently displaying the grating than anywhere else. Error bars represent SEM. Asterisks mark significant differences between the probabilities of landing in a given region of the image in the two temporal intervals (p < 0.01; two-tailed paired t test). (B) Average horizontal gaze position during presentation of each of the two gratings (same data as in Figure 2B) after removal of the microsaccades from the recorded eye movement traces. Drift segments for the entire trial duration were concatenated by subtracting all microsaccade displacements, so that the gaze position of the first sample after a microsaccade was made equal to that of the last sample before the microsaccade. Error bars represent SEM. See also Figure S4 and Movies S1, S2, and S3.
Figure 4
Figure 4
Necessity of Microsaccades Discrimination performance in the normal (unstabilized) trials with and without microsaccades. The two panels show data for two different observers. The proportions of correct responses in the trials in which microsaccades brought the center of gaze within 5′ from both bars (filled squares) and in the remaining trials, in which microsaccades did occur but were less precise (empty squares), are also shown. Error bars represent SEM; *p < 0.05; **p < 0.01; paired two-tailed t tests.

Comment in

References

    1. Weymouth FW, Hines DC, Acres LH, Raaf JE, Wheeler MC. Visual acuity within the area centralis and its relation to eye movements and fixation. Am. J. Ophthalmol. 1928;11:947–960.
    1. Jacobs RJ. Visual resolution and contour interaction in the fovea and periphery. Vision Res. 1979;19:1187–1195. - PubMed
    1. Legge GE, Kersten D. Contrast discrimination in peripheral vision. J. Opt. Soc. Am. A. 1987;4:1594–1598. - PubMed
    1. Hansen T, Pracejus L, Gegenfurtner KR. Color perception in the intermediate periphery of the visual field. J. Vis. 2009;9:1–12. - PubMed
    1. Nandy AS, Tjan BS. Saccade-confounded image statistics explain visual crowding. Nat. Neurosci. 2012;15:463–469. S1–S2. - PMC - PubMed

Publication types