One number does not fit all: mapping local variations in resolution in cryo-EM reconstructions
- PMID: 23954653
- PMCID: PMC3837392
- DOI: 10.1016/j.jsb.2013.08.002
One number does not fit all: mapping local variations in resolution in cryo-EM reconstructions
Abstract
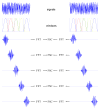
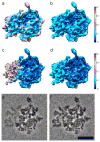
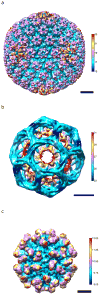
The resolution of density maps from single particle analysis is usually measured in terms of the highest spatial frequency to which consistent information has been obtained. This calculation represents an average over the entire reconstructed volume. In practice, however, substantial local variations in resolution may occur, either from intrinsic properties of the specimen or for technical reasons such as a non-isotropic distribution of viewing orientations. To address this issue, we propose the use of a space-frequency representation, the short-space Fourier transform, to assess the quality of a density map, voxel-by-voxel, i.e. by local resolution mapping. In this approach, the experimental volume is divided into small subvolumes and the resolution determined for each of them. It is illustrated in applications both to model data and to experimental density maps. Regions with lower-than-average resolution may be mobile components or ones with incomplete occupancy or result from multiple conformational states. To improve the interpretability of reconstructions, we propose an adaptive filtering approach that reconciles the resolution to which individual features are calculated with the results of the local resolution map.
Keywords: Cryo-electron microscopy; Image heterogeneity; Masking; Resolution; Short-space Fourier transform; Three-dimensional reconstruction.
Published by Elsevier Inc.
Figures


Similar articles
-
Automated particle picking for low-contrast macromolecules in cryo-electron microscopy.J Struct Biol. 2014 Apr;186(1):1-7. doi: 10.1016/j.jsb.2014.03.001. Epub 2014 Mar 6. J Struct Biol. 2014. PMID: 24607413 Free PMC article.
-
Rotationally invariant image representation for viewing direction classification in cryo-EM.J Struct Biol. 2014 Apr;186(1):153-66. doi: 10.1016/j.jsb.2014.03.003. Epub 2014 Mar 12. J Struct Biol. 2014. PMID: 24631969 Free PMC article.
-
Quantifying the local resolution of cryo-EM density maps.Nat Methods. 2014 Jan;11(1):63-5. doi: 10.1038/nmeth.2727. Epub 2013 Nov 10. Nat Methods. 2014. PMID: 24213166 Free PMC article.
-
Refinement of Atomic Structures Against cryo-EM Maps.Methods Enzymol. 2016;579:277-305. doi: 10.1016/bs.mie.2016.05.033. Epub 2016 Jun 24. Methods Enzymol. 2016. PMID: 27572731 Review.
-
Tools for Model Building and Optimization into Near-Atomic Resolution Electron Cryo-Microscopy Density Maps.Methods Enzymol. 2016;579:255-76. doi: 10.1016/bs.mie.2016.06.003. Epub 2016 Aug 12. Methods Enzymol. 2016. PMID: 27572730 Free PMC article. Review.
Cited by
-
Local resolution estimates of cryoEM reconstructions.Curr Opin Struct Biol. 2020 Oct;64:74-78. doi: 10.1016/j.sbi.2020.06.005. Epub 2020 Jul 7. Curr Opin Struct Biol. 2020. PMID: 32645578 Free PMC article. Review.
-
New tools for the analysis and validation of cryo-EM maps and atomic models.Acta Crystallogr D Struct Biol. 2018 Sep 1;74(Pt 9):814-840. doi: 10.1107/S2059798318009324. Epub 2018 Sep 3. Acta Crystallogr D Struct Biol. 2018. PMID: 30198894 Free PMC article.
-
Deriving and refining atomic models in crystallography and cryo-EM: the latest Phenix tools to facilitate structure analysis.Acta Crystallogr D Struct Biol. 2019 Oct 1;75(Pt 10):878-881. doi: 10.1107/S2059798319013391. Epub 2019 Oct 1. Acta Crystallogr D Struct Biol. 2019. PMID: 31588919 Free PMC article.
-
Thresholding of cryo-EM density maps by false discovery rate control.IUCrJ. 2019 Jan 1;6(Pt 1):18-33. doi: 10.1107/S2052252518014434. eCollection 2019 Jan 1. IUCrJ. 2019. PMID: 30713700 Free PMC article.
-
Time-resolved cryo-EM visualizes ribosomal translocation with EF-G and GTP.Nat Commun. 2021 Dec 13;12(1):7236. doi: 10.1038/s41467-021-27415-0. Nat Commun. 2021. PMID: 34903725 Free PMC article.
References
-
- Cardone G, Grünewald K, Steven AC. A resolution criterion for electron tomography based on cross-validation. J Struct Biol. 2005;151:117–129. - PubMed
Publication types
MeSH terms
Substances
Grants and funding
LinkOut - more resources
Full Text Sources
Other Literature Sources

