

Neurochemical changes within human early blind occipital cortex
- PMID: 23954804
- PMCID: PMC4476245
- DOI: 10.1016/j.neuroscience.2013.08.004
Neurochemical changes within human early blind occipital cortex
Abstract
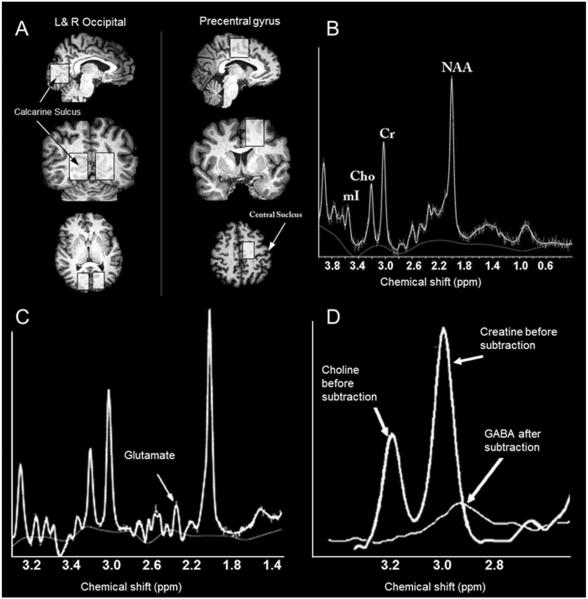
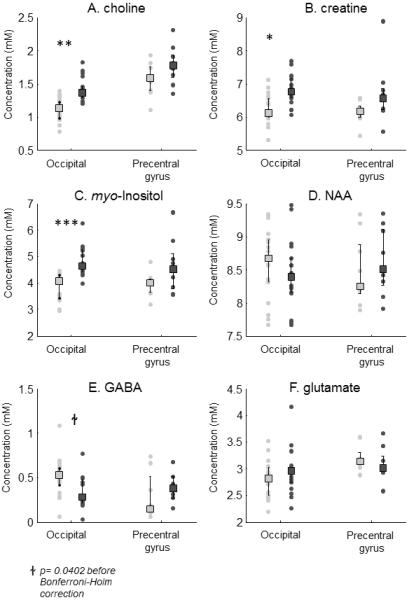
Early blindness results in occipital cortex neurons responding to a wide range of auditory and tactile stimuli. These changes in tuning properties are accompanied by an extensive reorganization of the occipital cortex that includes alterations in anatomical structure, neurochemical and metabolic pathways. Although it has been established in animal models that neurochemical pathways are heavily affected by early visual deprivation, the effects of blindness on these pathways in humans is still not well characterized. Here, using (1)H magnetic resonance spectroscopy in nine early blind and normally sighted subjects, we find that early blindness is associated with higher levels of creatine, choline and myo-Inositol and indications of lower levels of GABA within the occipital cortex. These results suggest that the cross-modal responses associated with early blindness may, at least in part, be driven by changes within occipital biochemical pathways.
Keywords: ANOVA; BOLD; CSF; EB; FID; FWHM; GM; MRS; N-acetyl aspartate; N-methyl-d-aspartate; NAA; NMDA; PET; PRESS; Position Resolved Spectroscopy; S/N; SC; WM; analysis of variance; blindness; blood-oxygen-level-dependent; cerebral spinal fluid; cross-modal plasticity; early blind; free-induction decay; full width at half maximum; gray matter; magnetic resonance spectroscopy; occipital; positron emission tomography; sighted control; signal to noise ratio; visual deprivation; white matter.
Copyright © 2013. Published by Elsevier Ltd.
Figures
Similar articles
-
Proton magnetic resonance spectroscopy (1H-MRS) reveals the presence of elevated myo-inositol in the occipital cortex of blind subjects.Neuroimage. 2009 Oct 1;47(4):1172-6. doi: 10.1016/j.neuroimage.2009.04.080. Epub 2009 May 5. Neuroimage. 2009. PMID: 19426816
-
Mechanisms of cross-modal plasticity in early-blind subjects.J Neurophysiol. 2010 Dec;104(6):2995-3008. doi: 10.1152/jn.00983.2009. Epub 2010 Jul 28. J Neurophysiol. 2010. PMID: 20668272 Free PMC article.
-
Neurochemical changes in the pericalcarine cortex in congenital blindness attributable to bilateral anophthalmia.J Neurophysiol. 2015 Sep;114(3):1725-33. doi: 10.1152/jn.00567.2015. Epub 2015 Jul 15. J Neurophysiol. 2015. PMID: 26180125 Free PMC article.
-
Properties of cross-modal occipital responses in early blindness: An ALE meta-analysis.Neuroimage Clin. 2019;24:102041. doi: 10.1016/j.nicl.2019.102041. Epub 2019 Oct 18. Neuroimage Clin. 2019. PMID: 31677587 Free PMC article.
-
Cross-modal plasticity for the spatial processing of sounds in visually deprived subjects.Exp Brain Res. 2009 Jan;192(3):343-58. doi: 10.1007/s00221-008-1553-z. Epub 2008 Sep 2. Exp Brain Res. 2009. PMID: 18762928 Review.
Cited by
-
Primary visual cortical remapping in patients with inherited peripheral retinal degeneration.Neuroimage Clin. 2016 Dec 21;13:428-438. doi: 10.1016/j.nicl.2016.12.013. eCollection 2017. Neuroimage Clin. 2016. PMID: 28116235 Free PMC article.
-
The visual white matter: The application of diffusion MRI and fiber tractography to vision science.J Vis. 2017 Feb 1;17(2):4. doi: 10.1167/17.2.4. J Vis. 2017. PMID: 28196374 Free PMC article. Review.
-
Early Blindness Results in Developmental Plasticity for Auditory Motion Processing within Auditory and Occipital Cortex.Front Hum Neurosci. 2016 Jul 5;10:324. doi: 10.3389/fnhum.2016.00324. eCollection 2016. Front Hum Neurosci. 2016. PMID: 27458357 Free PMC article.
-
Altered visual cortex excitatory/inhibitory ratio following transient congenital visual deprivation in humans.Elife. 2025 May 16;13:RP98143. doi: 10.7554/eLife.98143. Elife. 2025. PMID: 40377962 Free PMC article.
-
Hearing colors: an example of brain plasticity.Front Syst Neurosci. 2015 Apr 14;9:56. doi: 10.3389/fnsys.2015.00056. eCollection 2015. Front Syst Neurosci. 2015. PMID: 25926778 Free PMC article.
References
-
- Argandona EG, Rossi ML, Lafuente JV. Visual deprivation effects on the s100beta positive astrocytic population in the developing rat visual cortex: a quantitative study. Brain Res Dev Brain Res. 2003;141:63–69. - PubMed
-
- Bear MF, Singer W. Modulation of visual cortical plasticity by acetylcholine and noradrenaline. Nature. 1986;320:172–176. - PubMed
Publication types
MeSH terms
Grants and funding
LinkOut - more resources
Full Text Sources
Other Literature Sources
