. 2013 Oct;15(10):1186-96.
doi: 10.1038/ncb2822. Epub 2013 Aug 18.

A tuberous sclerosis complex signalling node at the peroxisome regulates mTORC1 and autophagy in response to ROS

Affiliations

A tuberous sclerosis complex signalling node at the peroxisome regulates mTORC1 and autophagy in response to ROS

Jiangwei Zhang et al. Nat Cell Biol. 2013 Oct.

Abstract

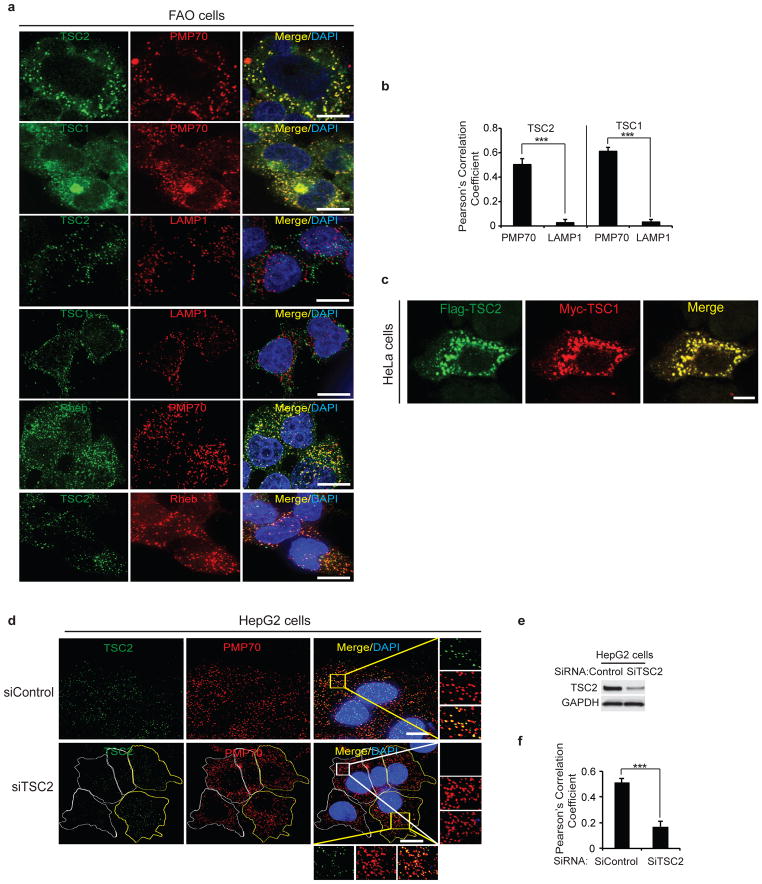
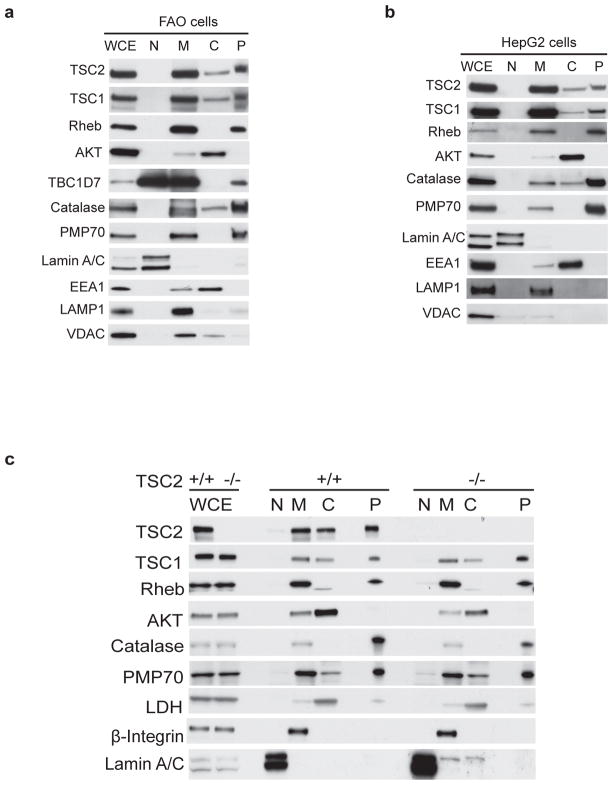
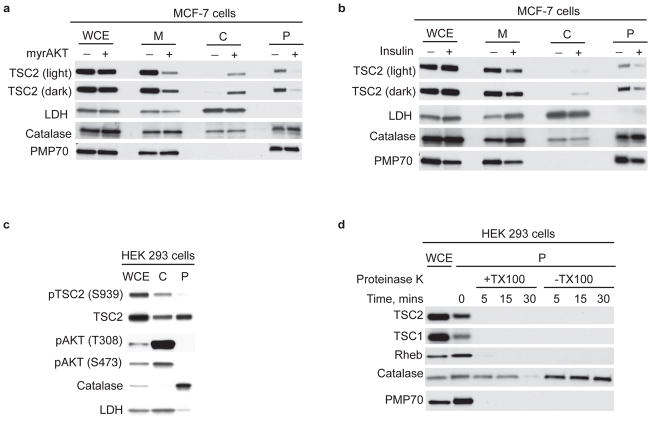
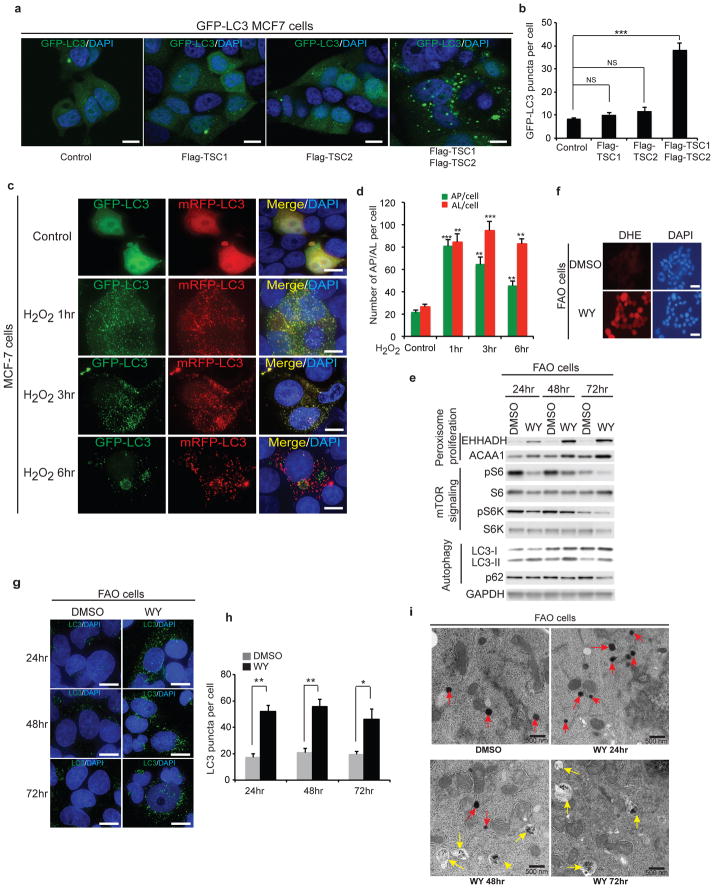
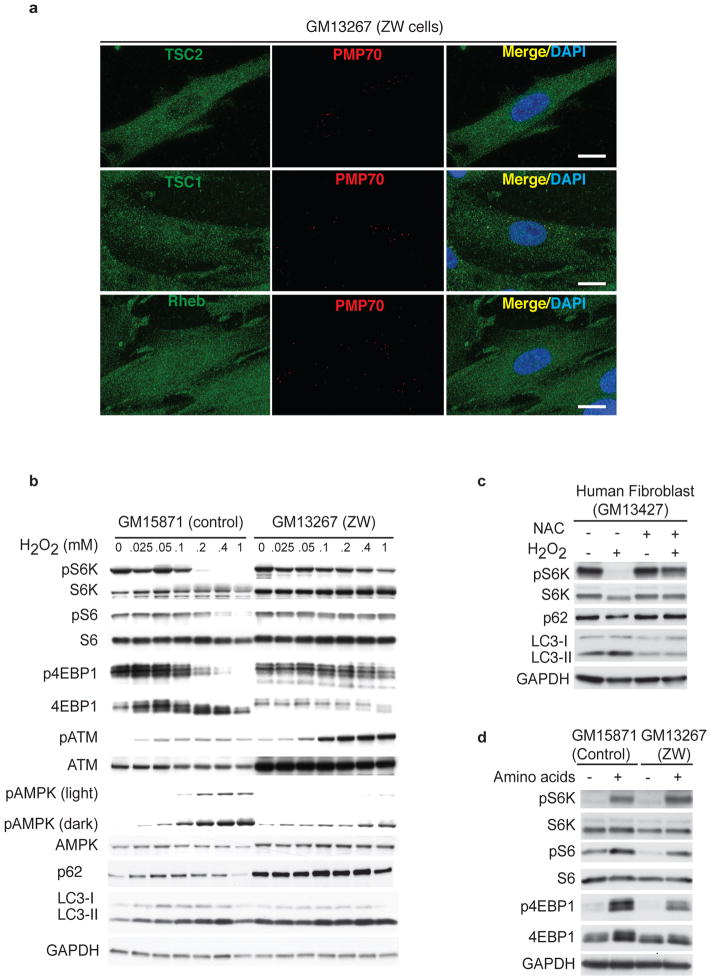
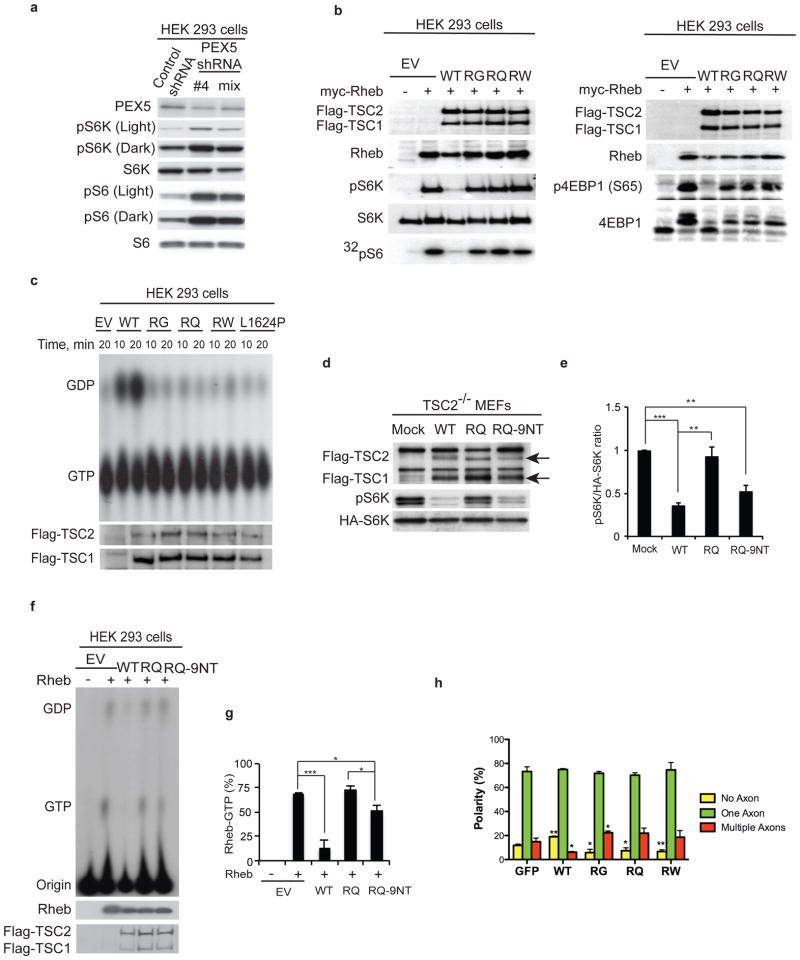
Subcellular localization is emerging as an important mechanism for mTORC1 regulation. We report that the tuberous sclerosis complex (TSC) signalling node, TSC1, TSC2 and Rheb, localizes to peroxisomes, where it regulates mTORC1 in response to reactive oxygen species (ROS). TSC1 and TSC2 were bound by peroxisomal biogenesis factors 19 and 5 (PEX19 and PEX5), respectively, and peroxisome-localized TSC functioned as a Rheb GTPase-activating protein (GAP) to suppress mTORC1 and induce autophagy. Naturally occurring pathogenic mutations in TSC2 decreased PEX5 binding, and abrogated peroxisome localization, Rheb GAP activity and suppression of mTORC1 by ROS. Cells lacking peroxisomes were deficient in mTORC1 repression by ROS, and peroxisome-localization-deficient TSC2 mutants caused polarity defects and formation of multiple axons in neurons. These data identify a role for the TSC in responding to ROS at the peroxisome, and identify the peroxisome as a signalling organelle involved in regulation of mTORC1.


Conflict of interest statement

COMPETING FINANCIAL INTERESTS

The authors declare that they have no competing financial interests.

Figures

Figure 1
Figure 1
TSC1 and TSC2 localization to peroxisomes. (a) Representative images of FAO cells immunostained with TSC2, TSC1 or Rheb (green) and PMP70 (peroxisome marker) or LAMP1 (lysosome marker) (red) antibodies. (Scale bar - 10μm). (b) Pearson’s Correlation Coefficient for TSC1 or TSC2 co-localization with PMP70 or LAMP1 calculated using Imaris software. Quantification was performed on 8–12 cells from each of the 4 independent experiment giving rise to a total of 40 cells. All error bars represent s.e.m., *** p < 0.001. (c) Representative images using HeLa cells transfected with Myc-TSC1 and Flag-TSC2 wild type (WT) and stained with anti-Flag (green) and anti-Myc (red) antobodies. (Scale bar - 10μm). (d) Representative images of HepG2 cells transfected with control (siControl) or TSC2 (siTSC2) siRNA immunostained for TSC2 (green) and PMP70 (red). Individual boundaries were shown to identify cells with TSC2 knockdown (white) versus cells that retain TSC2 (yellow). (Scale bar - 10μm). (e) Corresponding immunoblots for HepG2 cells transfected with control (siControl) or TSC2 (siTSC2) siRNA showing extent of knockdown (average over population of cells). (f) HepG2 cells from Fig. 1d were analyzed for Pearson’s Correlation Coefficient of TSC2 co-localization with PMP70 using Imaris software. Quantification was performed on 8–12 cells from each of the 4 independent experiment giving rise to a total of 40 cells. All error bars represent s.e.m., *** p < 0.001. Uncropped images of western blots are shown in Supplementary Fig. S6. Source data of statistical analysis are shown in Supplementary Table S1.
Figure 2
Figure 2
Cell fractionation demonstrating the TSC signaling node at the peroxisome. (a and b) Subcellular fractionation of FAO (a) or HepG2 (b) cells demonstrated the localization of TSC2, TSC1, Rheb, TBC1D7 (FAO, Fig. 2a) and AKT in various subcellular compartments. Catalase, PMP70 and Lamin A/C were used as subcellular markers for the peroxisome (P) and nuclear (N) fractions, respectively. EEA1, LAMP1 and VDAC were used as markers for endosomes, lysosomes, and mitochondria, respectively. WCE – whole cell extracts, M-membrane, C-cytosol. (c) Subcellular fractionation of TSC2+/+ and TSC2−/− MEFs demonstrating the localization of TSC2, TSC1, Rheb and AKT. PMP70, catalase (peroxisome fraction - P), LDH (cytosolic fraction - C), β-integrin (membrane fraction - M) and lamin A/C (nuclear fraction - N) were used as subcellular markers. WCE – whole cell extracts. Uncropped images of western blots are shown in Supplementary Fig. S6.
Figure 3
Figure 3
Active TSC signaling node resident at peroxisome membrane. (a) Western analysis of whole cell extracts (WCE), membrane (M), cytosolic (C) and peroxisome (P) fractions from parental and MCF-7 cells stably expressing constitutively active myristoylated AKT (myr-AKT) immunoblotted for TSC2, LDH, catalase and PMP70. Light and dark represent short and long autoradiographic exposures, respectively. (b) Western analysis of whole cell extracts (WCE), membrane (M), cytosolic (C) and peroxisome (P) fractions from MCF-7 cells stimulated with insulin (200 nM) for 30 min after 1h of serum starvation and immunoblotted for TSC2, LDH, catalase and PMP70. Light and dark represent short and long autoradiographic exposures, respectively. (c) Representative western analysis of HEK 293 whole cell extracts (WCE), cytosolic (C), and peroxisome (P) fractions, immunoblotted for phospho-TSC2 (S939) (inactive), TSC2, and phospho-AKT (S473 and T308) (activated). LDH and catalase were used as markers for the cytosolic (C) and peroxisome (P) fractions, respectively. (d) Proteinase K protection assays performed in the presence or absence of Triton X-100 to disrupt peroxisomess on equal masses of peroxisome (P) fractions (HEK 293 cells) collected at the indicated time points. The lysates were immunoblotted for TSC2, TSC1, Rheb, catalase and PMP70. WCE –whole cell extract. Uncropped images of western blots are shown in Supplementary Fig. S6.
Figure 4
Figure 4
The TSC signaling node at the peroxisome induces autophagy in response to ROS. (a) Representative merged images using GFP-LC3 MCF-7 cells expressing Flag-TSC1, Flag TSC2 or both Flag-TSC1 and Flag-TSC2 showing GFP-LC3 (green) puncta. (Scale bar - 10μm). (b) Quantification of GFP-LC3 puncta was performed and the results are represented as the average puncta fluorescence per cell (±s.e.m., n = 3 independent experiments) from 100 cells per experiment as shown in Fig. 4a. *** p < 0.001, NS, not significant. (c) Representative immunocytochemistry images using MCF-7 cells transfected with an mRFP-GFP-LC3 construct. Cells treated with 0.4 mM H2O2 were analyzed at 0hr (Control), 1hr, 3hr and 6hr. (Scale bar - 10μm). (d) Quantification of autophagosomes (AP, GFP-LC3) and autolysosomes (AL, RFP-LC3) per cell in different conditions as shown in Fig. 4c. The results are represented as the average puncta fluorescence per cell (±s.e.m., n = 3 independent experiments) from 100 cells per experiment. ** p < 0.01, *** p < 0.001. (e) Western analysis of FAO cells treated with 50 μM WY-14643 (WY) or vehicle (DMSO) for PPAR-alpha-inducible proteins (EHHADH and ACAA1), mTORC1 signaling proteins [(pS6 (S235/236), S6, pS6K (T389) and S6K)] and autophagy markers (LC3 and p62). (f) Representative images of FAO cells treated with vehicle (DMSO) or 50 μM WY-14643 (WY) for 1hr, with superoxide production detected using dihydroethidium (DHE). (Scale bar - 30μm). (g) Representative images of LC3 puncta (green) in FAO cells following treatment of 50 μM WY-14643 (WY) or vehicle (DMSO) for indicated time period. (Scale bar - 10μm). (h) Quantification of LC3 puncta per cell in response to WY-14643 (WY) or vehicle (DMSO). The results are represented as the average LC3 puncta fluorescence per cell (±s.e.m., n = 3 independent experiments) from 100 cells per experiment as shown in Fig. 4a. * p < 0.05, ** p < 0.01. (i) Transmission electron microscopy of FAO cells treated with vehicle (DMSO) or 50 μM WY-14643 (WY) for 24, 48 and 72 hr. Peroxisomes and autophagosomes are indicated with red and yellow arrows, respectively. (Scale bar - 500nm). Uncropped images of western blots are shown in Supplementary Fig. S6. Source data of statistical analysis are shown in Supplementary Table S1.
Figure 5
Figure 5
TSC’s ability to suppress mTORC1 is abrogated in peroxisome-deficient Zellweger cells. (a) Representative images of Zellweger cells (GM13267) showing endogenous TSC2, TSC1 and Rheb (green) co-localization with PMP70 (red). (Scale bar - 15μm). (b) Western analysis of human fibroblasts obtained from Zellweger (GM13267) or corresponding control patient with [Ehlers-Danlos syndrome (GM15871)] treated with indicated doses of H2O2 for 1hr. mTORC1 signaling was assessed by western analysis for pS6K (T389), S6K, pS6 (S235/236), S6, p4EBP1 (T37/46), 4EBP1, pATM (S1981), ATM, pAMPK (T172), AMPK, p62 and LC3. (c) Western analysis of human fibroblast (GM13427) cells pre-incubated with 3 mM NAC (ROS scavenger) for 1hr before treated with 0.4 mM H2O2 for 1hr using anti-pS6K (T389), S6K, p62 and LC3 antibodies. (d) Representative western analysis using cell extracts from human fibroblasts obtained from a Zellweger patient (GM13267) or control fibroblasts (GM15871) treated with amino acid free media for 60 min, and stimulated with mixture of amino acid for 10 min. mTOR signaling was monitored using anti-pS6K (T389), S6K, pS6 (S235/236), S6, p4EBP1(T37/46), and 4EBP1 antibodies. Uncropped images of western blots are shown in Supplementary Fig. S6.
Figure 6
Figure 6
TSC1 and TSC2 interact with PEX19 and PEX5. (a) Immunoprecipitation was performed with anti-PEX5 (left panel), anti-PEX19 (right panel) in HEK 293 cells and immunoblotted for endogenous TSC1, TSC2, mTOR (negative control) and PMP70, and PEX1 (PEX19 cargo) or catalase (PEX5 cargo). (b) Schematic of TSC2 C-terminus (aa1517 – aa1807) showing the GAP and PEX5 binding sequence (PxBS), naturally occurring mutations and the re-introduced SKL sequence. (c) Representative images of FAO cells transfected with DsRed-Del-ARL (deleted ARL sequence) (red) and GFP-PTS1 (green) (top panel). FAO cells were also transfected with DsRed-ARL (red) and stained for PMP70 or catalase (green) as indicated. (Scale bar - 10μm). (d) HEK 293 cells expressing Flag-TSC2 wild type (WT) or Flag-TSC2 mutants (RQ, RW, and RG) were co-immunoprecipitated using anti-Flag or anti-PEX5, and blotted for PEX5 and Flag-TSC2. (e) Representative experiment showing subcellular fractionation of HEK 293 cells overexpressing Flag-TSC2 wild type (WT) and Flag-TSC2 mutants (RQ, RW and RG). Lysates from peroxisome (P) or membrane (M) fractions and whole cell extracts (WCE) were immunoblotted with Flag or PMP70 antibodies. (f) Co-immunoprecipitation of HEK 293 cells overexpressing Flag-TSC2 wild type (WT), or Flag-TSC2 mutants (RQ) or Flag-TSC2 rescue mutant (RQ-9NT) using anti-Flag antibody or control IgG and immunoblotted with anti-Flag and anti-PEX5 antibodies. (g) Subcellular fractionation of TSC2−/− MEFs transfected with Flag-TSC2 wild type (WT), or Flag-TSC2 mutants (RQ or RQ-9NT). β-integrin and catalase were used as subcellular markers for membrane (M) and peroxisome (P) fractions, respectively. WCE – whole cell extract. The arrow indicates the position of overexpressed Flag-TSC2. (h) HEK 293 cells co-transfected with Flag-TSC1 and Flag-TSC2 wild type (WT) or Flag-TSC2 G294E mutant (TSC2 mutant that cannot bind TSC1). Lysates were immunoprecipitated using anti-PEX19 and blotted for PEX19 and Flag. (i) Representative blots from subcellular fractionation of HEK 293 cells overexpressing wild type (WT) or mutant (CaaX mutant) Flag-Rheb. LDH, Lamin A/C and catalase were used as subcellular markers for the cytoplasmic (Cp), nuclear (N), and peroxisome (P) fractions, respectively. WCE – whole cell extracts. Uncropped images of western blots are shown in Supplementary Fig. S6.
Figure 7
Figure 7
TSC2 functions at the peroxisome to repress mTORC1. (a) HEK 293 cells were transfected with either control shRNA or a PEX5 targeting shRNA, and lysates were blotted using pS6K (T389), S6K, pS6 (S235/236) and S6 antibodies. (b) TSC2 functional assay was performed in HEK 293 cells co-expressing myc-Rheb, Flag-TSC1 and Flag-TSC2 wild type (WT), or Flag-TSC2 mutants (RG, RQ and RW) and HA-S6K (left panel) or HA-4EBP1 (right panel). Cells transfected with empty vector (EV) with or without myc-Rheb were used as controls. Lysates were further analyzed for phospho-S6K (T389), S6K, phospho-4EBP1 (S65), 4EBP1 and 32P-incorporation into S6. (c) Rheb GTPase activity assays was performed by co-immunoprecipitating TSC heterodimers from HEK 293 cells expressing Flag-TSC1 and Flag-TSC2 wild type (WT), Flag-TSC2 mutants (RG, RQ and RW), or Flag-TSC2 GAP-mutant (L1624P) performed for the indicated time. (d) TSC2 functional assay was performed using TSC2−/− MEFs co-transfected with Flag-TSC1, HA-S6K, and Flag-TSC2 wild type (WT) or Flag-TSC2 mutants (RQ or RQ-9NT), with mock transfected cells as controls. Arrows denote the positions of Flag-TSC1 and Flag-TSC2. (e) Quantitation of the ratio of phospho-S6K to total HA-S6K from Fig 7d. (±s.e.m., n = 3 independent experiments). *p < 0.05, **p < 0.01. (f) In vivo guanine nucleotide loading assays of Rheb was measured using HEK 293 cells overexpressing Flag-TSC1 and Flag-TSC2 wild type (WT), or Flag-TSC2 mutants (RQ and RQ-9NT) with or without Rheb as indicated. (g) Graph shows quantitation of the percentage of Rheb bound to GTP (indicative of Rheb GTPase activity, ±s.e.m., n = 4 independent experiments). *p < 0.05, ***p < 0.001. (h) Quantification of axon number in hippocampal neurons co-transfected with GFP, Flag-TSC1 and Flag-TSC2 WT or Flag-TSC2 mutants (RG, RQ, and RW). No axons = yellow, one axon = green, and multiple axons = red. Quantification was performed on 150–250 neurons from each of the 3 independent experiment and the results are represented as polarity (%). All error bars represent s.e.m., *p < 0.05, ** p < 0.01 compared to GFP only transfected control. Uncropped images of western blots are shown in Supplementary Fig. S6. Source data of statistical analysis are shown in Supplementary Table S1.

Comment in

References

    1. Crino PB, Nathanson KL, Henske EP. The tuberous sclerosis complex. N Engl J Med. 2006;355:1345–1356. - PubMed
    1. Gomez MR, Sampson JR, Whittemore VH. Tuberous sclerosis complex. 3. Oxford University Press; New York; Oxford: 1999.
    1. Aspuria PJ, Tamanoi F. The Rheb family of GTP-binding proteins. Cell Signal. 2004;16:1105–1112. - PubMed
    1. Huang J, Manning BD. The TSC1-TSC2 complex: a molecular switchboard controlling cell growth. Biochem J. 2008;412:179–190. - PMC - PubMed
    1. He C, Klionsky DJ. Regulation mechanisms and signaling pathways of autophagy. Annu Rev Genet. 2009;43:67–93. - PMC - PubMed

Publication types

MeSH terms