

Probabilistic brains: knowns and unknowns
- PMID: 23955561
- PMCID: PMC4487650
- DOI: 10.1038/nn.3495
Probabilistic brains: knowns and unknowns
Abstract
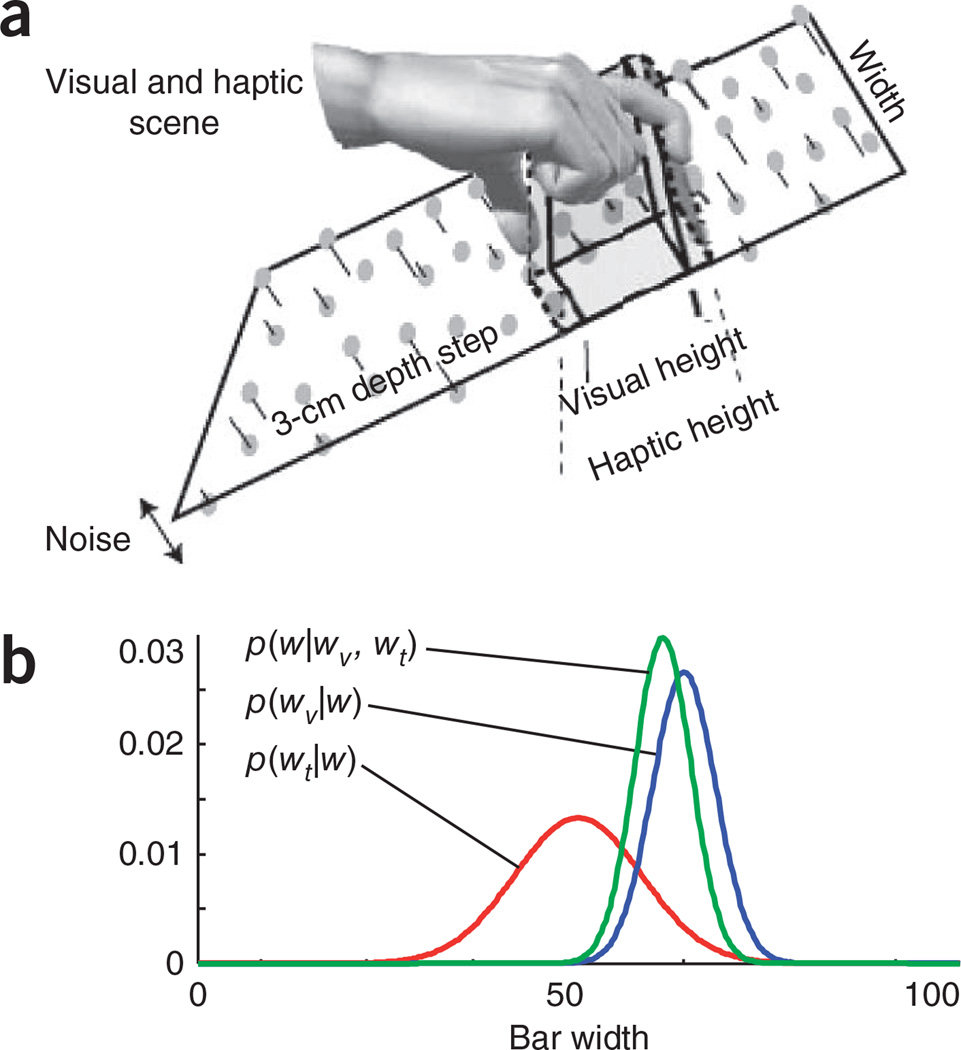
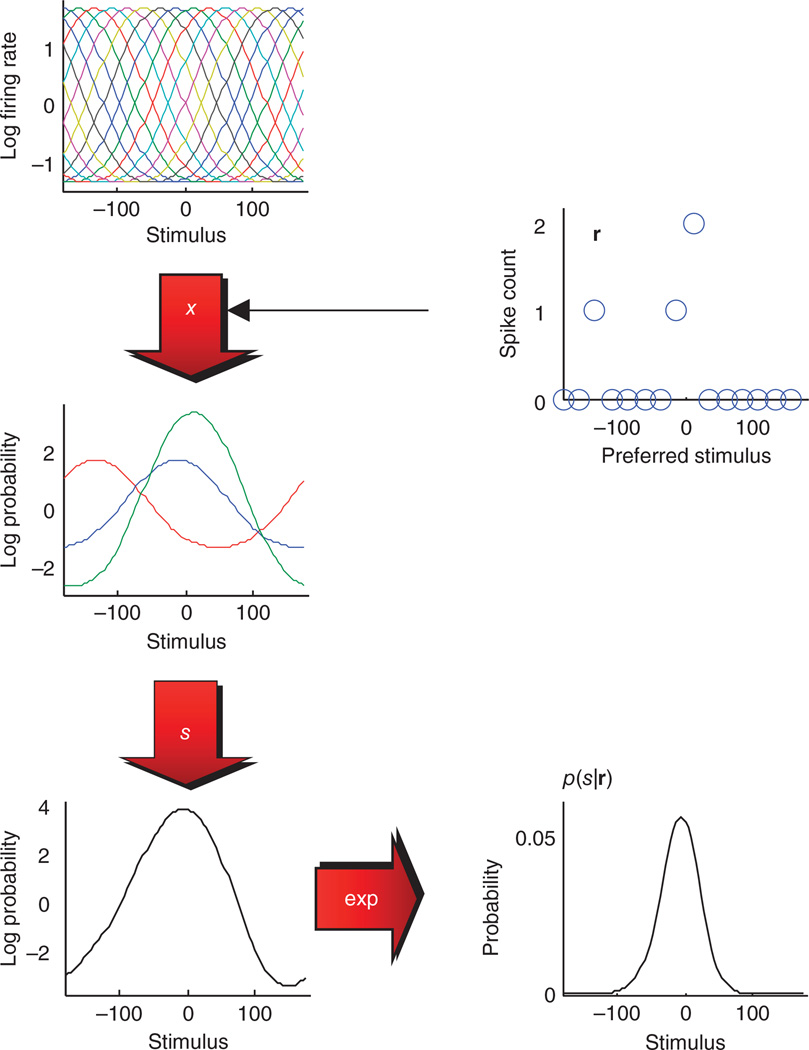
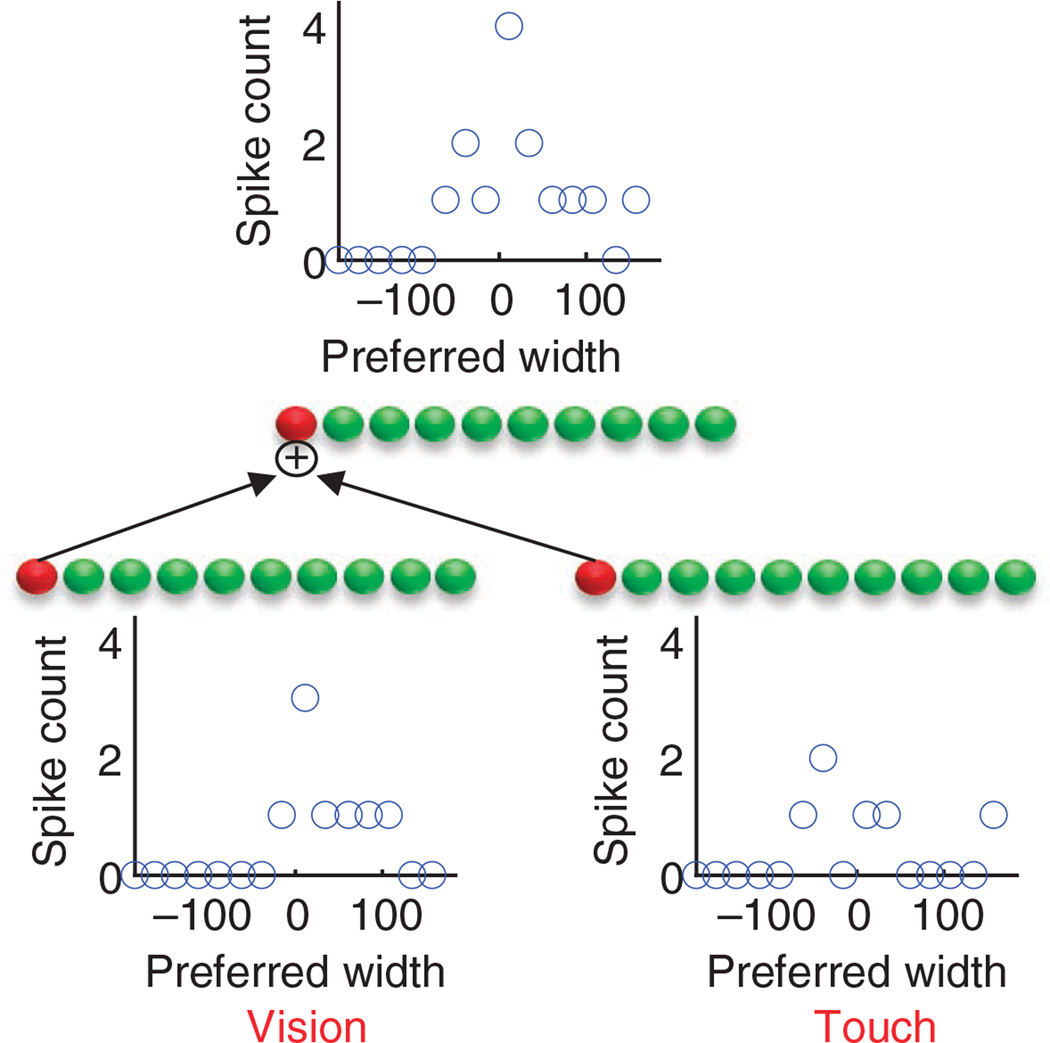
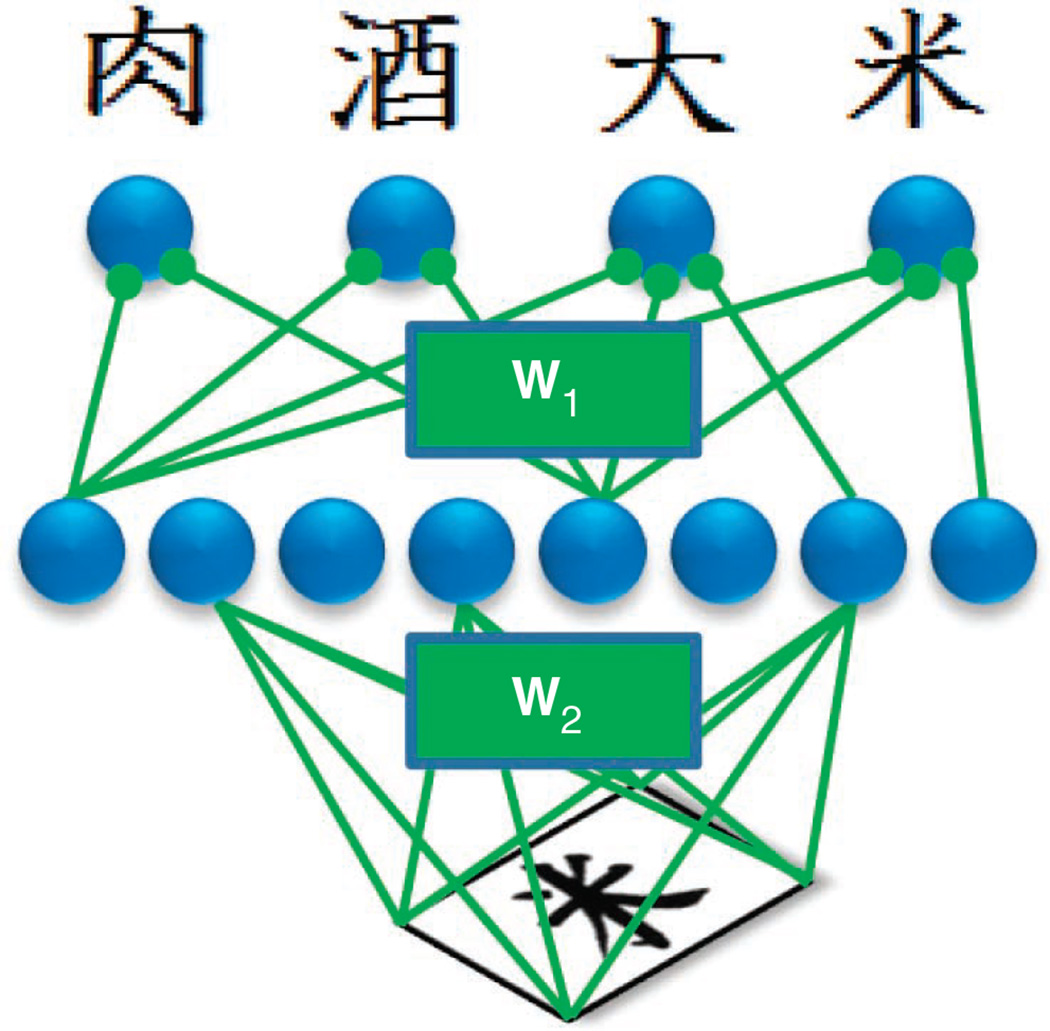
There is strong behavioral and physiological evidence that the brain both represents probability distributions and performs probabilistic inference. Computational neuroscientists have started to shed light on how these probabilistic representations and computations might be implemented in neural circuits. One particularly appealing aspect of these theories is their generality: they can be used to model a wide range of tasks, from sensory processing to high-level cognition. To date, however, these theories have only been applied to very simple tasks. Here we discuss the challenges that will emerge as researchers start focusing their efforts on real-life computations, with a focus on probabilistic learning, structural learning and approximate inference.
Figures
Similar articles
-
Fractional neural sampling as a theory of spatiotemporal probabilistic computations in neural circuits.Nat Commun. 2022 Aug 5;13(1):4572. doi: 10.1038/s41467-022-32279-z. Nat Commun. 2022. PMID: 35931698 Free PMC article.
-
Efficient probabilistic inference in generic neural networks trained with non-probabilistic feedback.Nat Commun. 2017 Jul 26;8(1):138. doi: 10.1038/s41467-017-00181-8. Nat Commun. 2017. PMID: 28743932 Free PMC article.
-
Inference in the Brain: Statistics Flowing in Redundant Population Codes.Neuron. 2017 Jun 7;94(5):943-953. doi: 10.1016/j.neuron.2017.05.028. Neuron. 2017. PMID: 28595050 Free PMC article. Review.
-
Probabilistic inference in general graphical models through sampling in stochastic networks of spiking neurons.PLoS Comput Biol. 2011 Dec;7(12):e1002294. doi: 10.1371/journal.pcbi.1002294. Epub 2011 Dec 15. PLoS Comput Biol. 2011. PMID: 22219717 Free PMC article.
-
The Redemption of Noise: Inference with Neural Populations.Trends Neurosci. 2018 Nov;41(11):767-770. doi: 10.1016/j.tins.2018.09.003. Trends Neurosci. 2018. PMID: 30366563 Free PMC article. Review.
Cited by
-
Vigilance, arousal, and acetylcholine: Optimal control of attention in a simple detection task.PLoS Comput Biol. 2022 Oct 31;18(10):e1010642. doi: 10.1371/journal.pcbi.1010642. eCollection 2022 Oct. PLoS Comput Biol. 2022. PMID: 36315594 Free PMC article.
-
Accelerated Physical Emulation of Bayesian Inference in Spiking Neural Networks.Front Neurosci. 2019 Nov 14;13:1201. doi: 10.3389/fnins.2019.01201. eCollection 2019. Front Neurosci. 2019. PMID: 31798400 Free PMC article.
-
Fractional neural sampling as a theory of spatiotemporal probabilistic computations in neural circuits.Nat Commun. 2022 Aug 5;13(1):4572. doi: 10.1038/s41467-022-32279-z. Nat Commun. 2022. PMID: 35931698 Free PMC article.
-
A spatially continuous diffusion model of visual working memory.Cogn Psychol. 2023 Sep;145:101595. doi: 10.1016/j.cogpsych.2023.101595. Epub 2023 Aug 31. Cogn Psychol. 2023. PMID: 37659278 Free PMC article.
-
Instance-based generalization for human judgments about uncertainty.PLoS Comput Biol. 2018 Jun 4;14(6):e1006205. doi: 10.1371/journal.pcbi.1006205. eCollection 2018 Jun. PLoS Comput Biol. 2018. PMID: 29864122 Free PMC article.
References
-
- Van Horn KS. Constructing a logic of plausible inference: a guide to Cox’s theorem. Int. J. Approx. Reason. 2003;34:3–24.
-
- De Finetti B, Machi A, Smith A. Theory of Probability: a Critical Introductory Treatment. New York: Wiley; 1993.
-
- Bayes T. An essay towards solving a problem in the doctrine of chances. Philos. Trans. R. Soc. Lond. 1763;53:370–418. - PubMed
-
- Laplace PS. Theorie Analytique des Probabilites. Paris: Ve Courcier; 1812.
-
- Stigler SM. Stigler’s law of eponymy. Trans. N. Y. Acad. Sci. 1980;39:147–158.
Publication types
MeSH terms
Grants and funding
LinkOut - more resources
Full Text Sources
Other Literature Sources
