Clinical Trial
. 2013 Sep;19(9):1178-83.
doi: 10.1038/nm.3289. Epub 2013 Aug 18.

Vessel architectural imaging identifies cancer patient responders to anti-angiogenic therapy

Affiliations
Clinical Trial

Vessel architectural imaging identifies cancer patient responders to anti-angiogenic therapy

Kyrre E Emblem et al. Nat Med. 2013 Sep.

Abstract

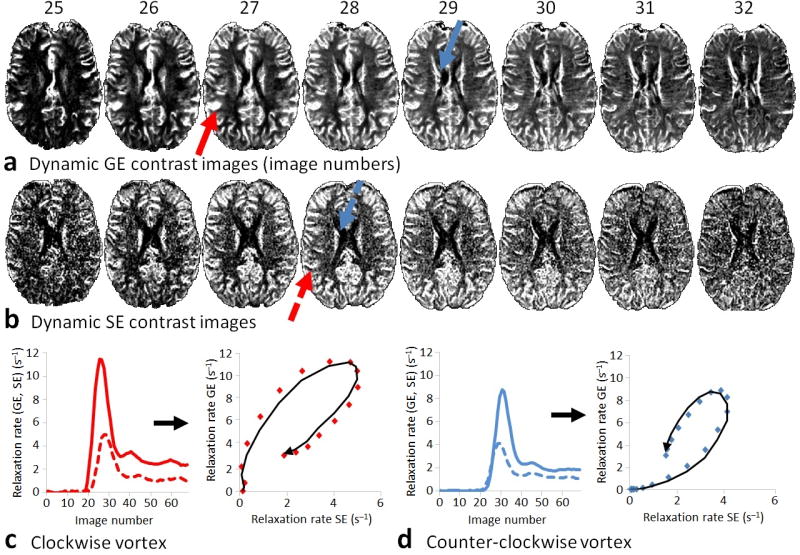
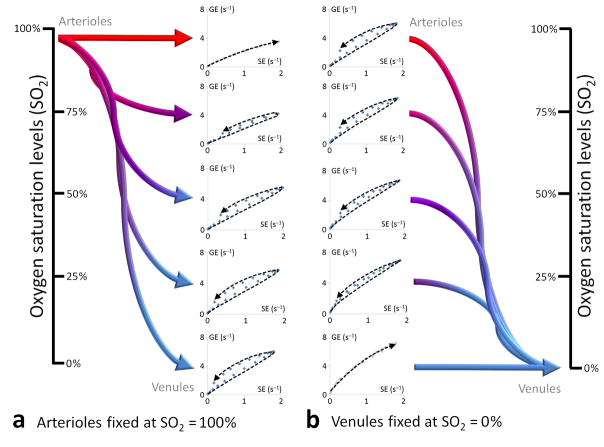
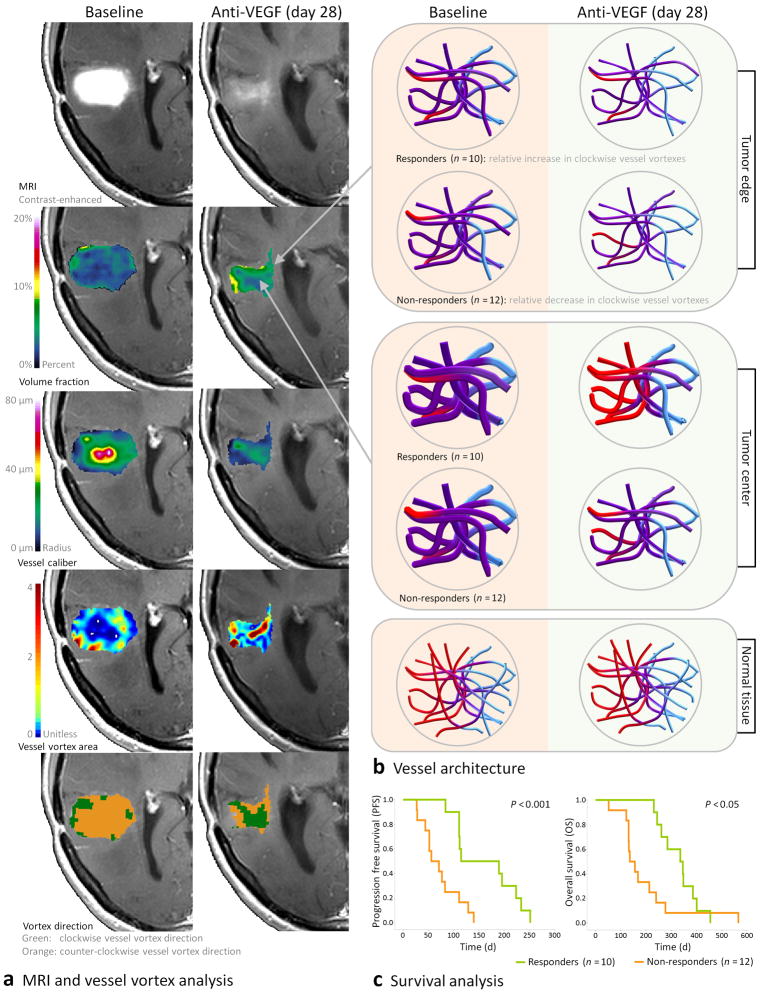
Measurement of vessel caliber by magnetic resonance imaging (MRI) is a valuable technique for in vivo monitoring of hemodynamic status and vascular development, especially in the brain. Here, we introduce a new paradigm in MRI termed vessel architectural imaging (VAI) that exploits an overlooked temporal shift in the magnetic resonance signal, forming the basis for vessel caliber estimation, and show how this phenomenon can reveal new information on vessel type and function not assessed by any other noninvasive imaging technique. We also show how this biomarker can provide new biological insights into the treatment of patients with cancer. As an example, we demonstrate using VAI that anti-angiogenic therapy can improve microcirculation and oxygen saturation and reduce vessel calibers in patients with recurrent glioblastomas and, more crucially, that patients with these responses have prolonged survival. Thus, VAI has the potential to identify patients who would benefit from therapies.

Trial registration: ClinicalTrials.gov NCT00035656.


Conflict of interest statement

CONFLICTS OF INTERESTS

KEE: Licensed patents: NordicNeuroLab AS.

KM: No potential conflicts of interest

AB: Board member: NordicNeuroLab AS. Licensed patents: NordicNeuroLab AS.

CTF: No potential conflicts of interest

DJ: No potential conflicts of interest

RJHB: No potential conflicts of interest

PYW: Research Support: Merck, Sanofi-Aventis, Genentech, Novartis, Medimmune, AstraZeneca, Amgen, Vascular Biogenics, Genzyme

PI: No potential conflicts of interest

TTB: Consultant/Advisory boards: Merck & Co., Inc., Roche, Kirin Pharmaceuticals, Champions Biotechnology, Advance Medical. Grant support: Pfizer, Astra Zeneca, Millenium

BR: Consultant/Advisory Board: Siemens Medical

RKJ: Grant support: Dyax, MedImmune, Roche. Consultant/Advisory boards: Dyax, Noxxon Pharma, SynDevRx. Equity and Board of Directors: Xtuit.

AGS: CEO, Siemens HealthCare USA. Grant support: Sanofi-aventis, Exelixis, Inc, Schering-Plough, Takeda Pharmaceutical Company Limited. Consultant/Advisory boards: Sanofi-aventis, Bayer AG, Mitsubishi, Biogen Idec Inc.

Figures

Figure 1
Figure 1
Vessel architectural imaging in a healthy volunteer. Simultaneously acquired (a) gradient-echo (GE) and (b) spin-echo (SE) contrast enhanced relaxation rate images showing the gradient-echo and spin-echo MR signals peaking at different image readouts during the contrast agent bolus passage. Typically, in areas with fast inflow of the contrast agent, such as in the feeding branches of the middle cerebral artery (red arrows), the gradient-echo signal peaks earlier than the spin-echo signal resulting in a clockwise vortex when plotting the relaxation rate curves in a point-by-point parametric plot (c). Correspondingly, in slow inflow areas, for example in the venules leading to the internal cerebral veins (blue arrows), the spin-echo signal peaks earlier than the gradient-echo signal resulting in a counter-clockwise vortex (d). The contrast agent-induced relaxation rates in (c–d) are scaled relative to their baseline rates (prior to contrast agent arrival), and will increase and decrease with a full-width half-maximum proportional to the mean transit time. Volume fraction (Vf) is defined as the area under the relaxation rate curves (percentage of blood in the image voxel ~ blood volume), whereas perfusion (~ flow) can be estimated using the central volume principle stating that Vf is the product of flow and mean transit time.
Figure 2
Figure 2
Parametric vessel vortex curves for different vessel combinations. Monte Carlo simulation showing the resulting point-by-point parametric vessel vortex curves from the gradient-echo (GE) and spin-echo (SE) relaxation rate curves following a theoretical contrast agent injection at different combinations of vessel radii and type. The vessel vortex curves vary in size, shape and direction (clockwise versus counter-clockwise) depending on the combination of vessel type and caliber. For vortex direction, a counter-clockwise vortex is observed only if slower inflow, venule-like vessels with larger calibers than the other vessel components (arterioles or capillaries) are included in the system. Compared to arterioles, healthy venules are typically characterized by larger vessel calibers with longer mean transit times and slower inflow. For all vessel combinations, Vf was kept at 3.5%, where an increase in vessel caliber (distension) implies a subsequent reduction in vessel density (negative recruitment). The SO2 levels were kept at normal values (arterioles at 90 – 95%, capillaries and venules at 50%), .
Figure 3
Figure 3
Responses in parametric vessel vortex curves to changes in oxygen saturation. Monte Carlo simulations showing resulting parametric vessel vortex curves for a uniform system of arterioles (R = 10 μm), capillaries (R = 3.5 μm) and venules (R = 10 μm) from changes in SO2 levels (Vf fixed at 3.5%). In (a), the SO2 levels in the arterioles are kept at 93% with capillary- and venule SO2 levels ranging from 93% (no consumption, i.e. from local shunting) to 0% (full consumption). In (b), the SO2 levels in the arterioles range from 93% to 0% with capillaries and venules SO2 levels fixed at 0%. Note that the slope, as would be identified by a linear fit of the vessel vortex curve and historically used as a measure proportional of vessel caliber, is higher in (b) compared to (a) at pathologic levels of SO2 even though the vessel caliber is unchanged (shown for 0% - 0% and 93% - 93%, respectively, with trend lines indicating no vortex curves). (GE = gradient-echo, SE = spin-echo).
Figure 4
Figure 4
Parametric vessel vortex curves of a responding subject with recurrent glioblastoma. (a) Contrast agent enhanced MRI (T1-weighted) at baseline (days −5 and −1) and during anti-angiogenic therapy (days 1, 28, 56 and 112). (b) Contrast enhancing tumor regions outlined on MRI showing tumor center (blue) and tumor edge (red). (c) Vessel caliber MRI. (d) Corresponding average vessel vortex curves from all pair-wise gradient-echo (GE) and spin-echo (SE) relaxation rate curves in the tumor center (blue vortex curves) and tumor edge (red vortex curves). Following anti-angiogenic drug administration, the contrast agent-enhanced tumor area recede while the average vessel vortex direction change from being predominantly counter-clockwise at baseline to a clockwise vortex direction during treatment (days 1 and 28), before reversing at day 56. This effect is most prominent in the tumor center and the subject was identified as a responder to the anti-angiogenic therapy by a relative increase image voxels with a clockwise vortex direction compared to the arithmetic mean of all subjects. (GEref, SEref = scaled to GE and SE reference curves, respectively).
Figure 5
Figure 5
Vessel architectural imaging during anti-angiogenic therapy in subjects with recurrent glioblastomas. (a) Example anatomical MRI and VAI of a subject with recurrent glioblastoma at baseline (day −1) and at day 28 after therapy onset. The images show (top-to-bottom); anatomical contrast enhanced T1-weighted images, volume fraction maps, vessel caliber maps, vessel vortex area maps and vessel vortex direction maps, respectively. At baseline, larger vessel calibers are observed in the tumor center compared to the tumor edge, with low oxygen extraction (low vessel vortex area values) and few voxels with a clockwise vessel vortex direction. (b) Corresponding vessel architecture in tumor edge, tumor center and reference tissue at baseline and day 28, respectively. The resulting vessel structures are based on average values from all 30 subjects, including vessel caliber, Vf, vessel vortex direction and vessel vortex area (Supplemental Table 1). Responding subjects (n = 10) show a move towards a more competent microcirculation during therapy identified by a relative increase in image voxels with a clockwise vessel vortex direction in the tumor center, with reduced vessel calibers and improved SO2 levels. Similar to normal tissue, red-to-violet-to-blue colors indicate normal appearing arteriole, capillary and venule hemodynamic status, respectively. (c) Kaplan-Meier survival curves show prolonged survival for responding subjects (median PFS = 153 d, OS = 341 d) compared to non-responding subjects (n = 12; median PFS = 64 d, OS = 146 d), the latter identified by a relative decrease in voxels with a clockwise vessel vortex direction.

References

    1. Carmeliet P, Jain RK. Molecular mechanisms and clinical applications of angiogenesis. Nature. 2011;473:298–307. - PMC - PubMed
    1. Goel S, et al. Normalization of the vasculature for treatment of cancer and other diseases. Physiological Reviews. 2011;91:1071–1121. - PMC - PubMed
    1. Willett CG, et al. Direct evidence that the VEGF-specific antibody bevacizumab has antivascular effects in human rectal cancer. Nat Med. 2004;10:145–147. - PMC - PubMed
    1. Batchelor TT, et al. AZD2171, a pan-VEGF receptor tyrosine kinase inhibitor, normalizes tumor vasculature and alleviates edema in glioblastoma patients. Cancer Cell. 2007;11:83–95. - PMC - PubMed
    1. Sorensen AG, et al. Increased Survival of Glioblastoma Patients Who Respond to Antiangiogenic Therapy with Elevated Blood Perfusion. Cancer Res. 2012;72:402–407. - PMC - PubMed

Publication types

MeSH terms

Associated data