. 2013 Oct;20(5):601-19.
doi: 10.1111/j.1744-7917.2012.01581.x. Epub 2012 Dec 11.

The effect of bacterial challenge on ferritin regulation in the yellow fever mosquito, Aedes aegypti

Affiliations

The effect of bacterial challenge on ferritin regulation in the yellow fever mosquito, Aedes aegypti

Dawn L Geiser et al. Insect Sci. 2013 Oct.

Abstract

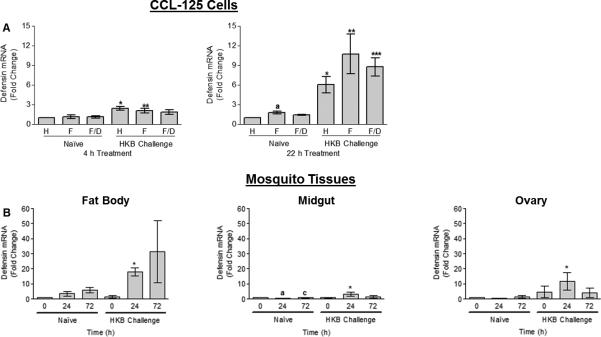
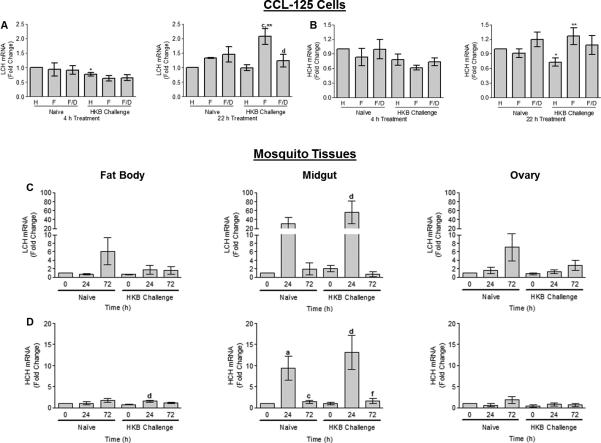
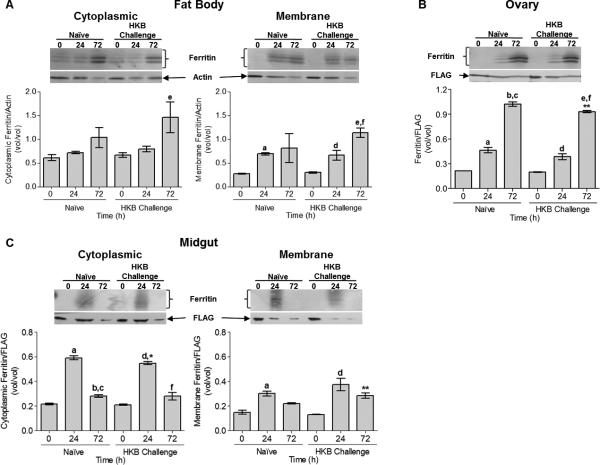
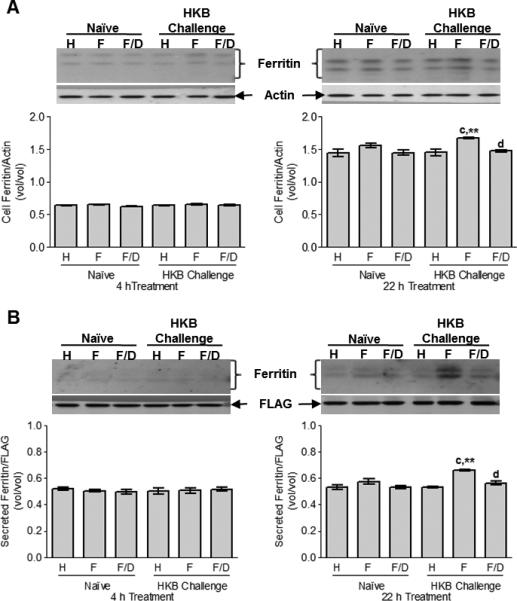
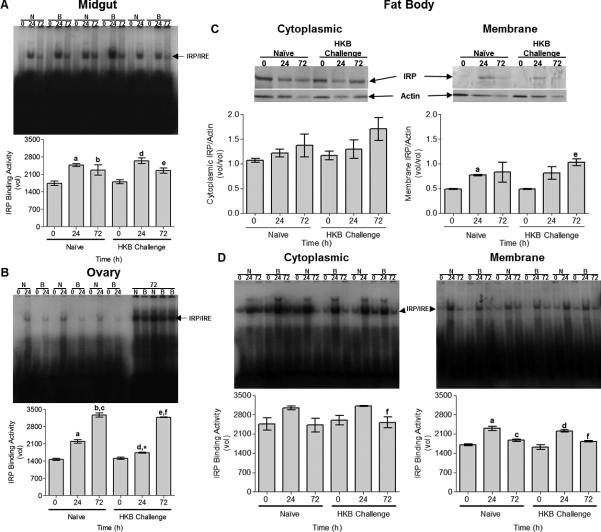
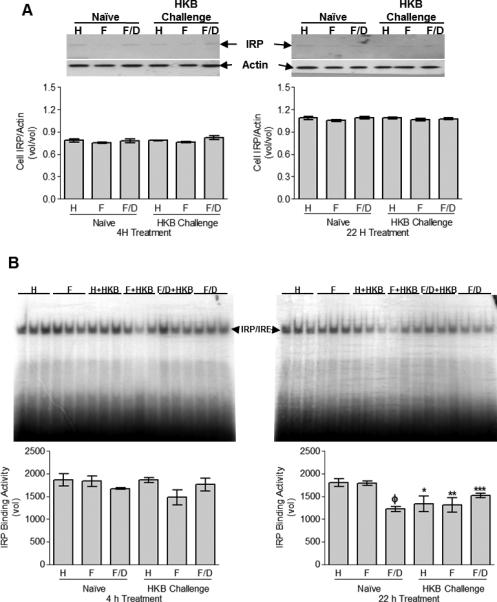
Secreted ferritin is the major iron storage and transport protein in insects. Here, we characterize the message and protein expression profiles of yellow fever mosquito (Aedes aegypti) ferritin heavy chain homologue (HCH) and light chain homologue (LCH) subunits in response to iron and bacterial challenge. In vivo experiments demonstrated tissue-specific regulation of HCH and LCH expression over time post-blood meal (PBM). Transcriptional regulation of HCH and LCH was treatment specific, with differences in regulation for naïve versus mosquitoes challenged with heat-killed bacteria (HKB). Translational regulation by iron regulatory protein (IRP) binding activity for the iron-responsive element (IRE) was tissue-specific and time-dependent PBM. However, mosquitoes challenged with HKB showed little change in IRP/IRE binding activity compared to naïve animals. The changes in ferritin regulation and expression in vivo were confirmed with in vitro studies. We challenged mosquitoes with HKB followed by a blood meal to determine the effects on ferritin expression, and demonstrate a synergistic, time-dependent regulation of expression for HCH and LCH.

Keywords: Aedes aegypti; IRP; bacteria; ferritin; iron; mosquito.


Figures

Fig. 1
Fig. 1
Quantification of defensin A1 (DefA1) transcript expression by real-time RT-PCR in CCL-125 cells (A) and female yellow fever mosquito, Aedes aegypti, tissues (B) exposed to iron or a blood meal and heat-killed bacteria (HKB). (A) CCL-125 cells were treated with HBSS (H), 100 μmol/L FAC (F) or 100 μmol/L FAC/ 100 μmol/L DES (F/D) as either naïve or HKB challenged cells. Cells were collected at 4 and 22 h post-treatment. *SD relative to naïve HBSS-treated cells 4 h (P < 0.008) and 22 h post-treatment (P < 0.02). **SD relative to naïve FAC-treated cells 4 h (P = 0.056) and 22 h post-treatment (P < 0.03). aSD relative to naïve 22 h HBSS-treated cells (P < 0.05). ***SD relative to naïve 22 h FAC/DES-treated cells (P < 0.007). (B) Female mosquitoes were injected with either mosquito saline (naïve) or heat-killed bacteria (HKB challenge) 3 h prior to blood feeding. Fat body (FB), midgut (MG) and ovary (OV) tissues were collected at 0, 24 and 72 h post-blood meal (PBM) and processed. *Significantly different (SD) relative to 24 h PBM naïve animals in FB (P < 0.005), MG (P < 0.04) and OV (P = 0.067). aSD relative to naïve animals 0 h PBM (P < 0.01). cSD relative to naïve animals 24 h PBM (P < 0.05). Graphed data represent means ± standard deviation (StD) of three independent cell culture samples and animal samples.
Fig. 2
Fig. 2
Quantification of ferritin light chain (LCH) and heavy chain homologue (HCH) transcript expression by real-time RT-PCR in CCL-125 cells (A–B) and female A. aegypti tissues (C–D) exposed to iron or a blood meal and HKB. (A–B) CCL-125 cells were treated with H, F or F/D as either naïve or HKB challenged cells. Cells were collected at 4 and 22 h post-treatment and processed. (A) CCL-125 cell LCH mRNA levels. *SD relative to naïve HBSS-treated cells (P < 0.002). cSD relative to HKB HBSS-treated cells (P < 0.01). **SD relative to naïve FAC-treated cells (P < 0.02). dSD relative to HKB FAC-treated cells (P < 0.05). (B) CCL-125 cell HCH mRNA levels. *SD relative to naïve HBSS-treated cells (P < 0.009). **SD relative to naïve FAC-treated cells (P = 0.05). (C–D) Female mosquitoes were either naïve or HKB challenged 3 h prior to blood feeding. FB, MG and OV tissues were collected at 0, 24 and 72 h PBM and processed. (C) Female mosquito tissues LCH mRNA levels. dSD relative to HKB treated animals 0 h PBM (P = 0.057). (D) Female mosquito tissues HCH mRNA levels. dSD relative to HKB animals 0 h PBM in FB (P < 0.05) and MG (P < 0.05). aSD relative to naïve animals 0 h PBM (P < 0.05). cSD relative to naïve animals 24 h PBM (P < 0.05). fSD relative to HKB animals 24 h PBM (P < 0.05). Graphed data represent means ± StD of three independent cell culture samples and animal samples.
Fig. 3
Fig. 3
Tissue expression of ferritin protein from female A. aegypti exposed to a blood meal and HKB was analyzed by Western blot. Female mosquitoes were naïve or challenged with HKB 3 h prior to blood feeding. FB, MG and OV tissues were collected at 0, 24 and 72 h PBM and processed. (A) FB cytoplasmic and membrane ferritin protein levels. eSD relative to HKB animals 0 h PBM for cytoplasmic (P = 0.052) and membrane extracts (P < 0.001). aSD relative to naïve animals 0 h PBM (P = 0.053). dSD relative to HKB animals 0 h PBM (P < 0.05). fSD relative to HKB animals 24 h PBM (P < 0.05). (B) OV tissue ferritin protein levels. aSD relative to naïve animals 0 h PBM (P < 0.01). bSD relative to naïve animals 0 h PBM (P <0.001). cSD relative to naïve animals 24 h PBM (P < 0.001). dSD relative to HKB animals 0 h PBM (P < 0.01). eSD relative to HKB animals 0 h PBM (P < 0.001). fSD relative to HKB animals 24 h PBM (P < 0.001). (C) MG cytoplasmic and membrane ferritin protein levels. aSD relative to naïve animals 0 h PBM for cytoplasmic (P < 0.001) and membrane extracts (P < 0.01). bSD relative to naïve animals 0 h PBM (P < 0.05). cSD relative to naïve animals 24 h PBM (P < 0.001). dSD relative to HKB animals 0 h PBM for cytoplasmic (P < 0.001) and membrane extracts (P < 0.01). fSD relative to HKB animals 24 h PBM (P < 0.001). Cytoplasmic ferritin levels are lower in HKB animals 24 h PBM (*P = 0.052) relative to naïve animals and membrane ferritin levels are greater in HKB animals 72 h PBM (**P = 0.052) relative to naïve animals. A representative Western blot is shown above the graphed data. Graphed data represent means ± StD of three independent animal samples.
Fig. 4
Fig. 4
CCL-125 cell-associated expression (A) and secretion (B) of ferritin protein with exposure to iron and HKB was analyzed by Western blot. CCL-125 cells were treated with H, F or F/D as either naïve or HKB challenged cells. Cells and medium were collected at 4 and 22 h post-treatment and processed. (A) Cell-associated ferritin levels. cSD relative to HKB HBSS-treated cells (P < 0.01). **SD relative to naïve FAC-treated cells (P < 0.02). dSD relative to HKB FAC-treated cells (P < 0.05). (B) Cell secreted ferritin levels in the media. cSD relative to HKB HBSS-treated cells (P < 0.001). **SD relative to naïve FAC-treated cells (P < 0.02). dSD relative to HKB FAC-treated cells (P < 0.01). A representative Western blot is shown above the graphed data. Data represent means ± StD of three independent cell culture samples.
Fig. 5
Fig. 5
Tissue iron regulatory protein (IRP)/ iron responsive element (IRE) binding activity (A–B, D) and FB IRP expression (C) from female A. aegypti exposed to a blood meal and HKB was analyzed by electrophoretic mobility shift assay (EMSA) and Western blot, respectively. Female mosquitoes were naïve or challenged with HKB 3 h prior to blood feeding. FB, MG and OV tissues were collected at 0, 24 and 72 h PBM and processed. (A) MG tissue IRP/IRE binding activity. aSD relative to naïve animals 0 h PBM (P < 0.01). bSD relative to naïve animals 0 h PBM (P < 0.05). dSD relative to HKB animals 0 h PBM (P < 0.01). eSD relative to HKB animals 0 h PBM (P < 0.05). (B) OV tissue IRP/IRE binding activity. aSD relative to naïve animals 0 h PBM (P < 0.001). bSD relative to naïve animals 0 h PBM (P < 0.001). cSD relative to naïve animals 24 h PBM (P < 0.001). dSD relative to HKB animals 0 h PBM (P < 0.01). *SD relative to naïve animals 24 h PBM (P < 0.002). eSD relative to HKB animals 0 h PBM (P < 0.001). fSD relative to HKB animals 24 h PBM (P < 0.001). (C) FB cytoplasmic and membrane IRP expression levels. aSD relative to naïve animals 0 h PBM (P =0.054). eSD relative to HKB animals 0 h PBM (P < 0.02). A representative Western blot is shown above the graphed data. (D) FB cytoplasmic and membrane IRP/IRE binding activity. fSD relative to HKB animals 24 h PBM in cytoplasmic (P = 0.057) and membrane extracts (P < 0.01). aSD relative to naïve animals 0 h PBM (P < 0.01). cSD relative to naïve animals 24 h PBM (P < 0.05). dSD relative to HKB animals 0 h PBM (P < 0.001). Each tissue EMSA gel autoradiographs are shown above the graphed data. Graphed data represent means ± StD of three independent animal samples.
Fig. 6
Fig. 6
CCL-125 cell-associated IRP expression (A) and IRP/IRE binding activity (B) with exposure to iron and HKB was analyzed by Western blot and EMSA, respectively. CCL-125 cells were treated with H, F or F/D as either naïve or HKB challenged cells. Cells were collected at 4 and 22 h post-treatment and processed. (A) Cell-associated IRP protein levels. A representative Western blot is shown above the graphed data. (B) Cell-associated IRP/IRE binding activity. ΦSD relative to naïve HBSS (P < 0.01) and FAC-treated cells (P < 0.01). *SD relative to naïve HBSS-treated cells (P < 0.04). **SD relative to naïve FAC-treated cells (P < 0.03). ***SD relative to naïve FAC/DES-treated cells (P < 0.008). The EMSA gel autoradiographs are shown above the graphed data. Graphed data represent means ± StD of three independent cell culture samples.

References

    1. Abraham EG, Jacobs-Lorena M. Mosquito midgut barriers to malaria parasite development. Insect Biochemistry & Molecular Biology. 2004;34:667–671. - PubMed
    1. Antonova Y, Alvarez KS, Kim YJ, Kokoza V, Raikhel AS. The role of NF-kappaB factor REL2 in the Aedes aegypti immune response. Insect Biochemistry and Molecular Biology. 2009;39:303–314. - PMC - PubMed
    1. Barray S, Devauchelle G. Study of the structural polypeptides of Chilo suppressalis iridescent virus (Iridovirus type 6) Canadian journal of microbiology. 1979;25:841–849. - PubMed
    1. Bartholomay LC, Cho WL, Rocheleau TA, Boyle JP, Beck ET, Fuchs JF, Liss P, Rusch M, Butler KM, Wu RC, Lin SP, Kuo HY, Tsao IY, Huang CY, Liu TT, Hsiao KJ, Tsai SF, Yang UC, Nappi AJ, Perna NT, Chen CC, Christensen BM. Description of the transcriptomes of immune response-activated hemocytes from the mosquito vectors Aedes aegypti and Armigeres subalbatus. Infection and Immunity. 2004;72:4114–4126. - PMC - PubMed
    1. Bartholomay LC, Mayhew GF, Fuchs JF, Rocheleau TA, Erickson SM, Aliota MT, Christensen BM. Profiling infection responses in the haemocytes of the mosquito, Aedes aegypti. Insect Molecular Biology. 2007;16:761–776. - PubMed

Publication types

MeSH terms

LinkOut - more resources