

Elevated fetal adipsin/acylation-stimulating protein (ASP) in obese pregnancy: novel placental secretion via Hofbauer cells
- PMID: 23956345
- PMCID: PMC3790615
- DOI: 10.1210/jc.2012-4293
Elevated fetal adipsin/acylation-stimulating protein (ASP) in obese pregnancy: novel placental secretion via Hofbauer cells
Abstract
Context and objective: Obesity in pregnancy is associated with increased risks of obesity in the offspring. We investigated the relationship between obesity in pregnancy and circulating maternal and fetal levels of adipose tissue-derived factors adipsin and acylation stimulating protein (ASP) in lean and obese mothers.
Design: Paired peripheral and cord blood samples were taken. Paired fat and placenta tissue were taken for explant culture. Media were assayed for secreted adipsin and ASP. Clinical parameters assayed included fasting insulin, glucose, and adipsin.
Setting: The study was conducted at a university hospital maternity unit.
Patients: Patients included 35 lean [body mass index (BMI) 19-25 kg/m(2), mean age 32 years and 39 obese (BMI) > 30 kg/m(2), mean age 32.49 years] pregnant Caucasian women, delivered by cesarean section at term.
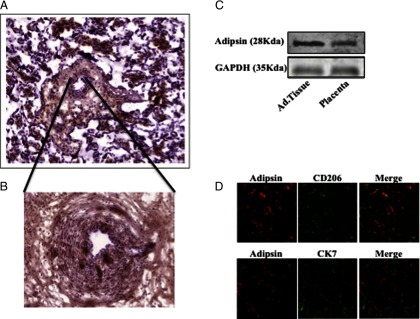
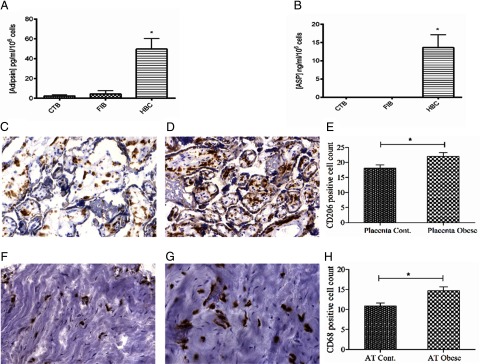
Main outcome measure: Identification of placental macrophages [Hofbauer cells (HBCs)], as a source of adipsin and ASP was determined.
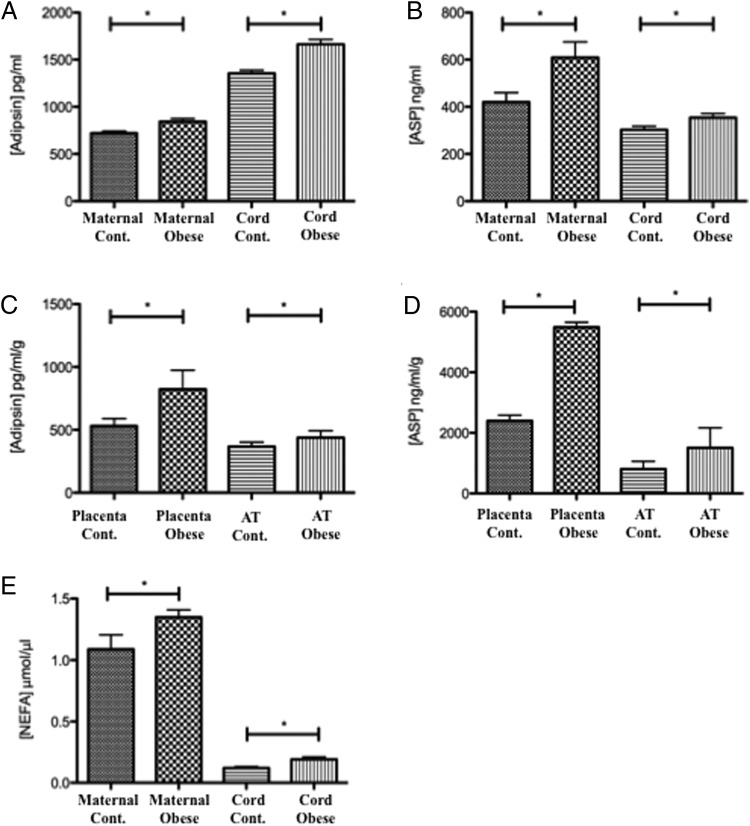
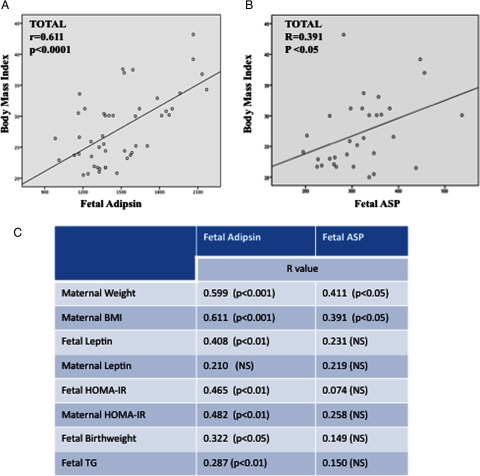
Results: HBCs secreted both adipsin and ASP. Cord levels of adipsin (1663.78 ± 52.76 pg/mL) and ASP (354.48 ± 17.17 ng/mL) were significantly elevated in the offspring of obese mothers compared with their lean controls [1354.66 ± 33.87 pg/mL and 302.63 ± 14.98 ng/mL, respectively (P < .05 for both)]. Placentae from obese mothers released significantly more adipsin and ASP than placentae from lean mothers [546.0 ± 44 pg/mL · g vs 284.56 ± 43 pg/mL · g and 5485.75 ± 163.32 ng/mL · g vs 2399.16 ± 181.83 ng/mL · g, respectively (P < .05 for both)]. Circulating fetal adipsin and ASP positively correlated with maternal BMI (r = 0.611, P < .0001, and r = 0.391, P < .05, respectively). Fetal adipsin correlated positively with maternal (r = 0.482, P < .01) and fetal homeostasis model assessment of insulin resistance (r = 0.465, P < .01).
Conclusions: We demonstrate novel secretion of adipsin and ASP by placental HBCs.
Figures
Similar articles
-
Sex-specific impact of maternal obesity on fetal placental macrophages and cord blood triglycerides.Placenta. 2023 Sep 7;140:100-108. doi: 10.1016/j.placenta.2023.08.001. Epub 2023 Aug 6. Placenta. 2023. PMID: 37566941 Free PMC article.
-
Acylation-stimulating protein precursor proteins in adipose tissue in human obesity.Metabolism. 2003 Oct;52(10):1360-6. doi: 10.1016/s0026-0495(03)00254-3. Metabolism. 2003. PMID: 14564690
-
Components of the alternative complement pathway in patients with psoriasis.Acta Dermatovenerol Alp Pannonica Adriat. 2017 Jun;26(2):37-40. doi: 10.15570/actaapa.2017.11. Acta Dermatovenerol Alp Pannonica Adriat. 2017. PMID: 28632884
-
Offspring body size and metabolic profile - effects of lifestyle intervention in obese pregnant women.Dan Med J. 2014 Jul;61(7):B4893. Dan Med J. 2014. PMID: 25123127 Review.
-
Placental Macrophage (Hofbauer Cell) Responses to Infection During Pregnancy: A Systematic Scoping Review.Front Immunol. 2022 Feb 11;12:756035. doi: 10.3389/fimmu.2021.756035. eCollection 2021. Front Immunol. 2022. PMID: 35250964 Free PMC article.
Cited by
-
Sex-specific impact of maternal obesity on fetal placental macrophages and cord blood triglycerides.Placenta. 2023 Sep 7;140:100-108. doi: 10.1016/j.placenta.2023.08.001. Epub 2023 Aug 6. Placenta. 2023. PMID: 37566941 Free PMC article.
-
The immune landscape of fetal chorionic villous tissue in term placenta.Front Immunol. 2025 Jan 13;15:1506305. doi: 10.3389/fimmu.2024.1506305. eCollection 2024. Front Immunol. 2025. PMID: 39872537 Free PMC article.
-
Role of complement factor D in cardiovascular and metabolic diseases.Front Immunol. 2024 Oct 2;15:1453030. doi: 10.3389/fimmu.2024.1453030. eCollection 2024. Front Immunol. 2024. PMID: 39416783 Free PMC article. Review.
-
Acylation-stimulating protein is a surrogate biomarker for acute myocardial infarction: Role of statins.J Lab Physicians. 2017 Jul-Sep;9(3):163-169. doi: 10.4103/0974-2727.208263. J Lab Physicians. 2017. PMID: 28706385 Free PMC article.
-
Complement activation in polycystic ovary syndrome occurs in the postprandial and fasted state and is influenced by obesity and insulin sensitivity.Clin Endocrinol (Oxf). 2021 Jan;94(1):74-84. doi: 10.1111/cen.14322. Epub 2020 Sep 15. Clin Endocrinol (Oxf). 2021. PMID: 32865246 Free PMC article.
References
-
- Finkelstein EA, Khavjou OA, Thompson H, Trogdon JG, Pan L, Sherry B, Dietz W. Obesity and severe obesity forecasts through 2030. Am J Prev Med. 2012;42:563–570 - PubMed
-
- Heslehurst N, Rankin J, Wilkinson JR, Summerbell CD. A nationally representative study of maternal obesity in England, UK: trends in incidence and demographic inequalities in 619 323 births, 1989–2007. Int J Obes (Lond). 2010;34:420–428 - PubMed
-
- Sebire NJ, Jolly M, Harris JP, et al. Maternal obesity and pregnancy outcome: a study of 287,213 pregnancies in London. Int J Obes Relat Metab Disord. 2001;25:1175–1182 - PubMed
-
- Dennedy MC, Avalos G, O'Reilly MW, O'Sullivan EP, Gaffney G, Dunne F. ATLANTIC-DIP: raised maternal body mass index (BMI) adversely affects maternal and fetal outcomes in glucose-tolerant women according to International Association of Diabetes and Pregnancy Study Groups (IADPSG) criteria. J Clin Endocrinol Metab. 2012;97:E608–E612 - PubMed
-
- Boney CM, Verma A, Tucker R, Vohr BR. Metabolic syndrome in childhood: association with birth weight, maternal obesity, and gestational diabetes mellitus. Pediatrics. 2005;115:e290–e296 - PubMed
Publication types
MeSH terms
Substances
Grants and funding
LinkOut - more resources
Full Text Sources
Other Literature Sources
Medical
Miscellaneous
