. 2013 Sep 15;191(6):3358-72.
doi: 10.4049/jimmunol.1300342. Epub 2013 Aug 16.

Resident renal mononuclear phagocytes comprise five discrete populations with distinct phenotypes and functions

Affiliations

Resident renal mononuclear phagocytes comprise five discrete populations with distinct phenotypes and functions

Takahisa Kawakami et al. J Immunol. .

Abstract

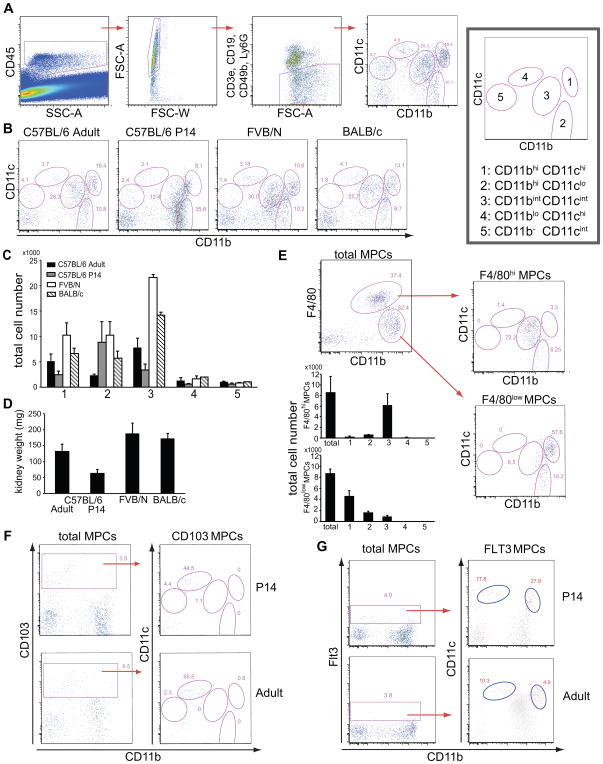
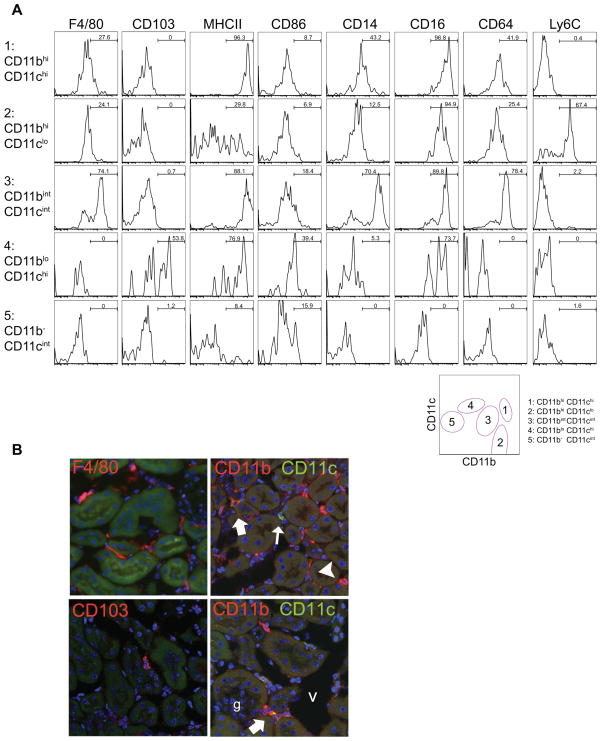
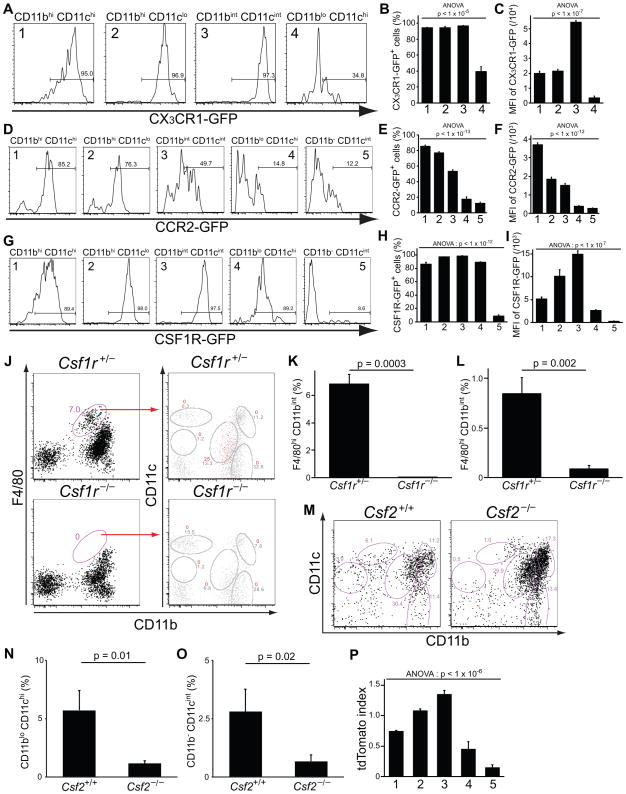
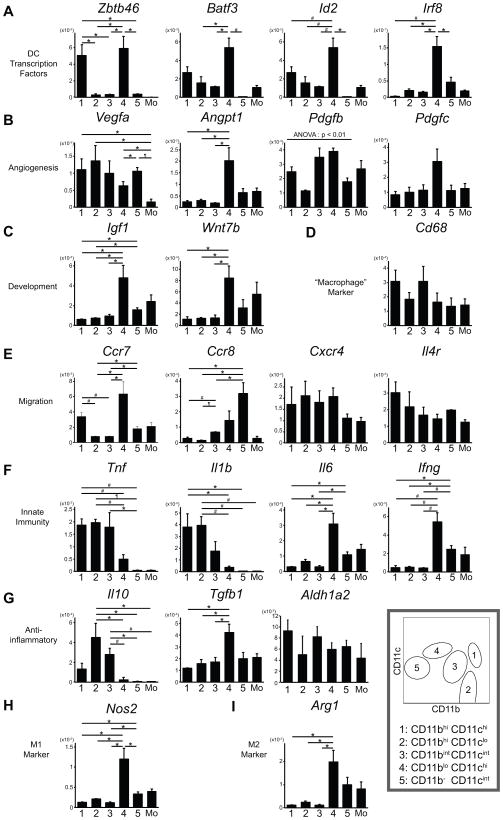
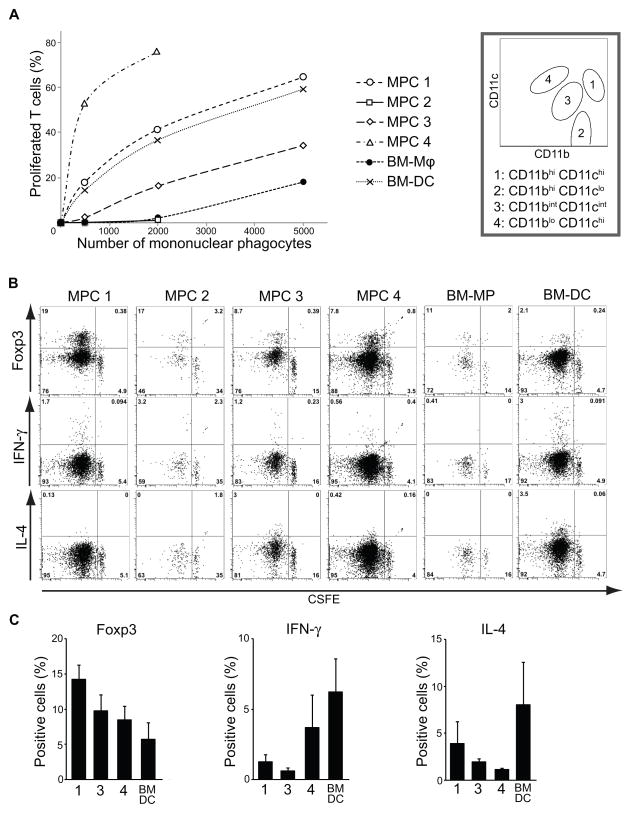
Recent reports have highlighted greater complexity, plasticity, and functional diversity of mononuclear phagocytes (MPCs), including monocytes, macrophages, and dendritic cells (DCs), in our organs than previously understood. The functions and origins of MPCs resident within healthy organs, especially in the kidney, are less well understood, whereas studies suggest they play roles in disease states distinct from recruited monocytes. We developed an unbiased approach using flow cytometry to analyze MPCs residing in the normal mouse kidney, and identified five discrete subpopulations according to CD11b/CD11c expression as well as F4/80, CD103, CD14, CD16, and CD64 expression. In addition to distinct marker profiles, these subpopulations have different lineages and expression of genes involved in tissue homeostasis, including angiogenesis. Among them, the CD11b(int)CD11c(int) F4/80(high) subpopulation notably exhibited high capacity to produce a representative anti-inflammatory cytokine, IL-10. Each subpopulation had different degrees of both macrophage (phagocytosis) and DC (Ag presentation) capacities, with a tendency to promote differentiation of regulatory T cells, whereas two of these showed expression of transcription factors reported to be highly expressed by classical DCs, and proclivity to exit the kidney following stimulation with LPS. In summary, resident kidney MPCs comprise discrete subpopulations, which cannot be simply classified into the conventional entities, and they produce anti-inflammatory and tissue-homeostatic factors to differing degrees.


Figures

Figure 1
Figure 1
Five distinct subpopulations of resident mononuclear phagocytes (MPCs) in normal kidney show both “macrophage” and “dendritic cell” markers by flow cytometry. (A) Gating strategy for identification of MPCs in normal mouse kidney concluded by a representative CD11b/CD11c flow cytometry plot of resident MPCs in normal kidney with right-hand plot showing key and nomenclature for each population. (B) Representative CD11b/CD11c MPC plots for 3 different strains of adult mice and 14 day old C57BL/6 mice with representative percentages. (C) Total number of each MPC subpopulation per kidney. (D) Average Kidney weight by mouse strain. (E) Representative CD11b, F4/80 plot of total MPCs (left) and CD11b/CD11c plots for F4/80hi MPCs (right, upper) and F4/80lo MPCs (right, lower). Most F4/80hi MPCs reside in CD11bint CD11cint subpopulation. Graphs show total numbers of F480hi and F4/80lo MPCs in each MPC population. (F) Plots showing CD103+ cells in young and adult kidneys and their distribution in CD11b/CD11c plots. (G) Plots (%) showing rare Flt3+ MPCs in young and adult normal kidney and their distribution (red events) in CD11b/CD11c plots. For (A) and (B), experiments were independently performed more than 30 times, using totally more than 80 mice. For others, experiments were independently performed twice or more, using three or more mice each time.
Figure 2
Figure 2
Heterogeneous expression of typical dendritic cell and macrophage markers by kidney MPCs. (A) Histogram plots showing expression of cell surface markers in resident MPC subpopulations in normal C57BL/6 mouse kidney. Representative plots from 3 independent experiments are shown. Bars show % in gated area (B) Fluorescence confocal micrographs (X400) showing CD11b, CD11c, F4/80 and CD103 expression in kidney cortex. Within the cortex F4/80hi and F4/80lo cells can be seen. Rare CD103+ CD3- cells can be seen and co-labeling with CD11b and CD11c identifies cells which express CD11b alone (arrowheads), CD11b and CD11c at high levels (broad arrows), CD11c alone (upper panel small closed arrow) and CD11c at high levels with CD11b at low levels (lower panel small closed arrow)
Figure 3
Figure 3
MPC subpopulations show differential expression of chemokine receptors, colony-stimulating factor-dependency and distinct ontogeny. Histograms (A, D, G), and graphs of percent positive (B, E, H), or mean fluorescence intensity (MFI) (C, F, I) of GFP in MPC subpopulations from CX3CR1GFP/+ kidneys (n = 3), CCR2-GFPTr mice (n = 4), and CSF1R-GFPTr mice (n = 3), respectively. (J) Representative plots of P14 juvenile kidney MPCs in control Csf1r+/− and Csf1r−/− mice at day 14. In right plots gated cells (%) are shown as red events whereas total events (%) are shown in grey. Note in juvenile kidneys MPC4 expresses CD11b at lower levels compared to adults. (K–L) Graphs showing the proportion of MPCs that are F4/80hi CD11bint MPCs (corresponding to CD11bint CD11cint MPC3) in control Csf1r+/− and Csf1r−/− mice at day 14 (K) (n = 3) or at day 0 (L) after birth. (M–O) Representative plots (%) of kidney MPCs (M) and a graph showing the proportion (N–O) of MPCs that are the CD11blo CD11chi subpopulation (MPC4) and CD11b CD11cint (MPC5) in adult control and adult Csf2−/− knockout mice (n = 3). (P) A graph showing the ratio of tdTomato-positive kidney MPCs normalized to monocytes in LysmCre/+;R26RtdTomato/+ monocyte fate reporter mice. 1: CD11bhi CD11chi, 2: CD11bhi CD11clo, 3: CD11bint CD11cint, 4: CD11blo CD11chi, 5: CD11b CD11cint. Data are represented as mean ± SEM.
Figure 4
Figure 4
Quantitative RT-PCR analysis of gene expression in normal kidney MPC subpopulations. The expression levels of the gene relative to GAPDH are shown (n = 3). 1: CD11bhi CD11chi, 2: CD11bhi CD11clo, 3: CD11bint CD11cint, 4: CD11blo CD11chi, 5: CD11b CD11cint, Mo: blood monocytes. Data are represented as mean ± SEM. * p < 0.05, # p <0.01, ¶ p < 1×10⁻³.
Figure 5
Figure 5
The capacity of kidney MPCs to phagocytose latex beads ex vivo. (A) Representative histograms of kidney MPC subpopulations after incubation with FITC-conjugated latex beads. (B–C) Graphs showing the proportion of MPCs with phagocytosed beads (B) and of mean fluorescence intensity (C) in each subpopulation (n =4). Data are represented as mean ± SEM.
Figure 6
Figure 6
Kidney MPC populations exhibit unique differential capacities for stimulating antigen-specific CD4+ T cell proliferation and polarization. (A) Graph showing the proportion of viable DO11.10/RAG2/−; T cells that have proliferated as measured by CFSE dilution after incubation with aliquots of ovalbumin peptide-pulsed MPCs from each purified kidney MPC subpopulation (MPC1: CD11bhi CD11chi, MPC2: CD11bhi CD11clo, MPC3: CD11bint CD11cint, MPC4: CD11blo CD11chi), or from bone marrow-derived macrophages (BM-Mφ) or bone marrow-derived DCs (BM-DC). (B) Representative flow cytometric plots showing T cell survival and proliferative responses (CSFE dilution) and expression of markers of differentiation (FoxP3, IFNγ, IL4) in response to incubation of 30,000 naïve T cells with 2000 ovalbumin peptide-pulsed APCs. Gates were set using isotype control and no APC experimental control. (C) Graphs showing the proportion of viable proliferated T cells that expressed intracellular Foxp3 (left panel) or produced intracellular IFNγ (middle) or IL-4 (right) after re-stimulation following initial incubation with 2000 APCs. BM-MP and BM-DC were used as controls. MPC2 and BM-MP were excluded due to failure to stimulate >75% of T cells to proliferate. Data are represented as mean ± SEM. The experimental conditions were reproduced in duplicates or triplicates and the experiment performed twice.
Figure 7
Figure 7
Quantitative RT-PCR analysis of gene expression in MPC subpopulations stimulated ex vivo with Lipopolysaccharide. The expression levels of the gene relative to GAPDH are shown (n =3). 1: CD11bhi CD11chi, 2: CD11bhi CD11clo, 3: CD11bint CD11cint, 4: CD11blo CD11chi, 5: CD11b CD11cint, Mo: blood monocytes. Data are represented as mean ± SEM. * p < 0.05, # p <0.01, ¶ p < 1×10⁻³, § p < 1×10⁻⁴.
Figure 8
Figure 8
Interleukin-10 expression and quantification of kidney MPC subpopulations in vivo in steady state or following systemic lipopolysaccharide exposure. (A) Representative flow cytometry plots of kidney MPCs in highly sensitive IL-10 reporter (Il10IB/IB) and control (Il10+/+) mice. The right panel shows the distribution of IL-10-positive cells by F4/80 and CD11b (n=4). (B) Representative plots and a graph of IL-10 positive cells showing a remarkable increase in IL-10 expression of kidney MPCs with systemic LPS treatment, with the right panel showing the distrubtion of IL10+ cells by F4/80 and CD11b. (C) IL-10 histograms in CD11bhi CD11clo (2), CD11bint CD11cint (3), and CD11blo CD11cint (5) cells and a graph showing the proportion of IL-10 positive cells within each subpopulation (n =3) indicating that the majority of IL10+ cells are MPC3. (D) Representative flow cytometry panels showing the distribution of MPCs with or without LPS stimulation. (E) The graph showing the changes in the absolute number of MPCs within each subpopulation normalized to kidney weight. The filled bars correspond to those treated with vehicle, while the blank bars correspond to those treated with LPS (n =3). (F–G) Representative plots showing non-lymphocyte cells in lymph nodes in steady state or 48h after LPS injection. Note marked increase in F4/80+ CD11b+ cells as well as CD11c+ cells. Data are represented as mean ± SEM. * p < 0.05, # p <0.01, ¶ p < 1×10⁻³.

References

    1. Geissmann F, Manz MG, Jung S, Sieweke MH, Merad M, Ley K. Development of monocytes, macrophages, and dendritic cells. Science. 2010;327:656–661. - PMC - PubMed
    1. Liu K, Victora GD, Schwickert TA, Guermonprez P, Meredith MM, Yao K, Chu FF, Randolph GJ, Rudensky AY, Nussenzweig M. In vivo analysis of dendritic cell development and homeostasis. Science. 2009;324:392–397. - PMC - PubMed
    1. Fogg DK, Sibon C, Miled C, Jung S, Aucouturier P, Littman DR, Cumano A, Geissmann F. A clonogenic bone marrow progenitor specific for macrophages and dendritic cells. Science. 2006;311:83–87. - PubMed
    1. Ginhoux F, Liu K, Helft J, Bogunovic M, Greter M, Hashimoto D, Price J, Yin N, Bromberg J, Lira SA, Stanley ER, Nussenzweig M, Merad M. The origin and development of nonlymphoid tissue CD103+ DCs. J Exp Med. 2009;206:3115–3130. - PMC - PubMed
    1. del Rio ML, Bernhardt G, Rodriguez-Barbosa JI, Forster R. Development and functional specialization of CD103+ dendritic cells. Immunol Rev. 2010;234:268–281. - PubMed

Publication types