

Attributable fraction functions for censored event times
- PMID: 23956459
- PMCID: PMC3744602
- DOI: 10.1093/biomet/asq023
Attributable fraction functions for censored event times
Abstract
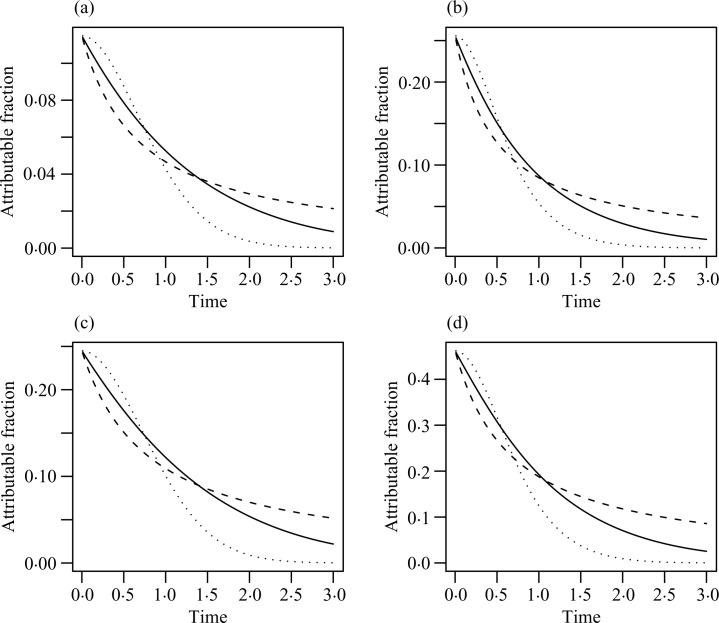
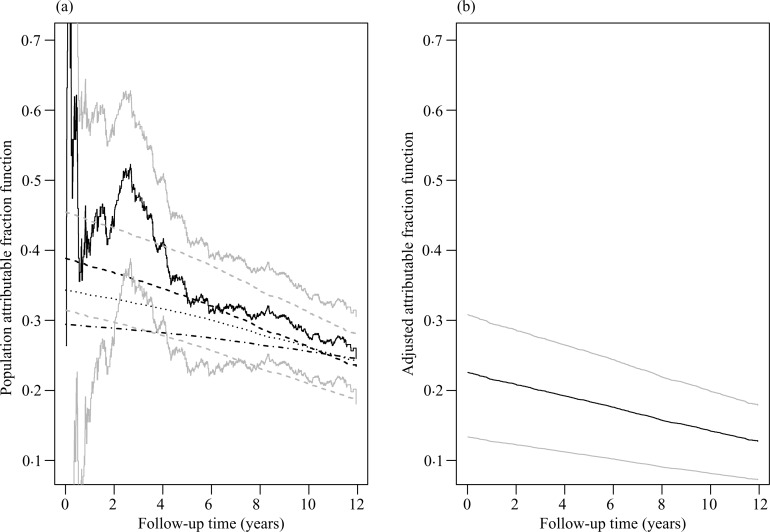
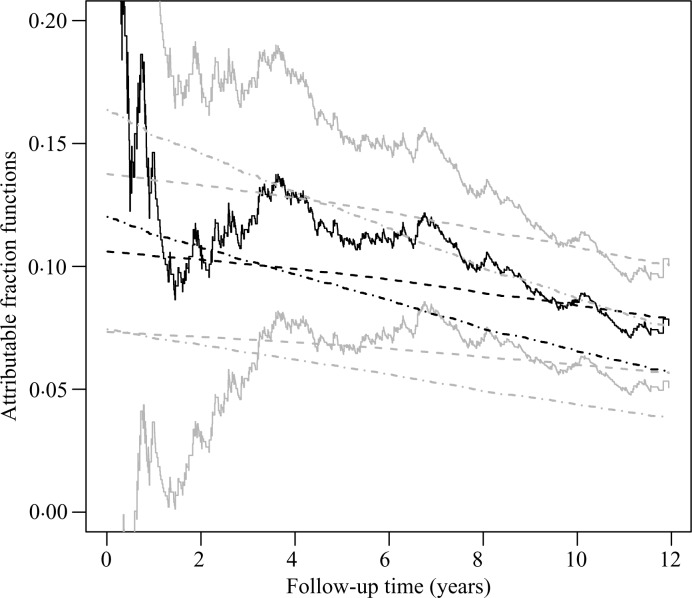
Attributable fractions are commonly used to measure the impact of risk factors on disease incidence in the population. These static measures can be extended to functions of time when the time to disease occurrence or event time is of interest. The present paper deals with nonparametric and semiparametric estimation of attributable fraction functions for cohort studies with potentially censored event time data. The semiparametric models include the familiar proportional hazards model and a broad class of transformation models. The proposed estimators are shown to be consistent, asymptotically normal and asymptotically efficient. Extensive simulation studies demonstrate that the proposed methods perform well in practical situations. A cardiovascular health study is provided. Connections to causal inference are discussed.
Keywords: Adjusted attributable fraction; Attributable risk; Cohort study; Population attributable fraction; Proportional hazards model; Transformation model.
Figures
References
-
- Akaike H. Prediction and entropy. In: Atkinson AC, Fienberg SE, editors. A Celebration of Statistics. New York: Springer; 1985. pp. 1–24.
-
- Benichou J. A review of adjusted estimators of attributable risk. Statist Meth: Med Res. 2001;10:195–216. - PubMed
-
- Breslow NE. Discussion of the paper by D. R. Cox. J. R. Statist. Soc. B. 1972;34:216–7.
-
- Bruzzi P, Green SB, Byar DP, Brinton LA, Schairer C. Estimating the population attributable risk for multiple risk factors using case-control data. Am J Epidemiol. 1985;122:904–14. - PubMed
-
- Chen YQ, Hu C, Wang Y. Attributable risk function in the proportional hazards model for censored time-to-event. Biostatistics. 2006;7:515–29. - PubMed
