

Identification of interconnected markers for T-cell acute lymphoblastic leukemia
- PMID: 23956970
- PMCID: PMC3727179
- DOI: 10.1155/2013/210253
Identification of interconnected markers for T-cell acute lymphoblastic leukemia
Abstract
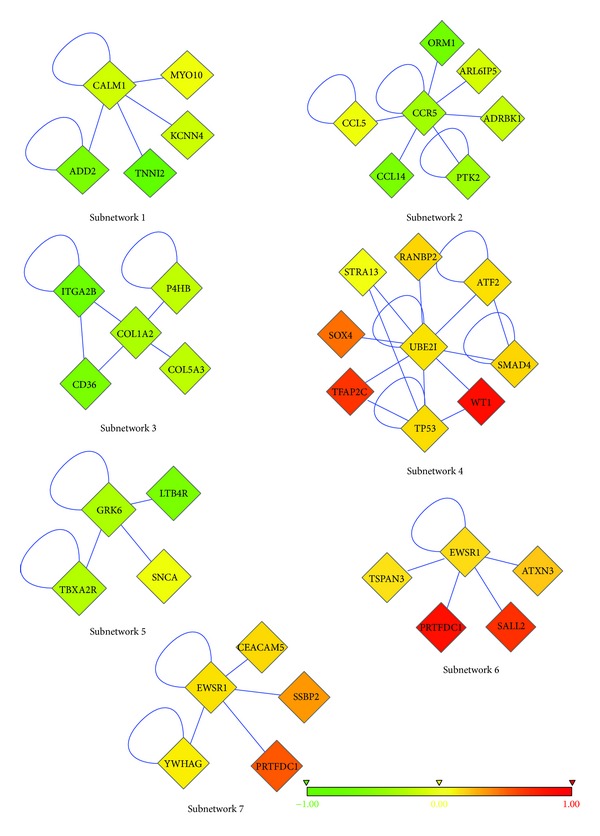
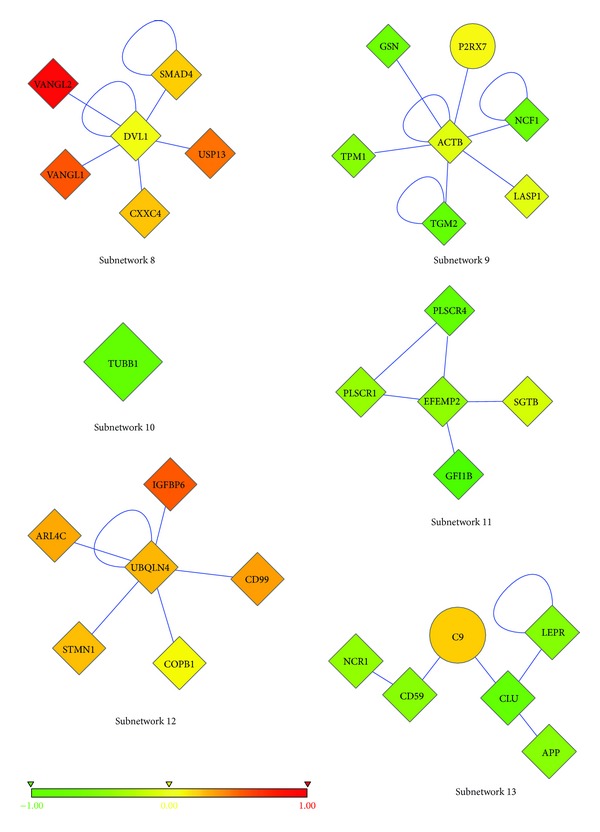
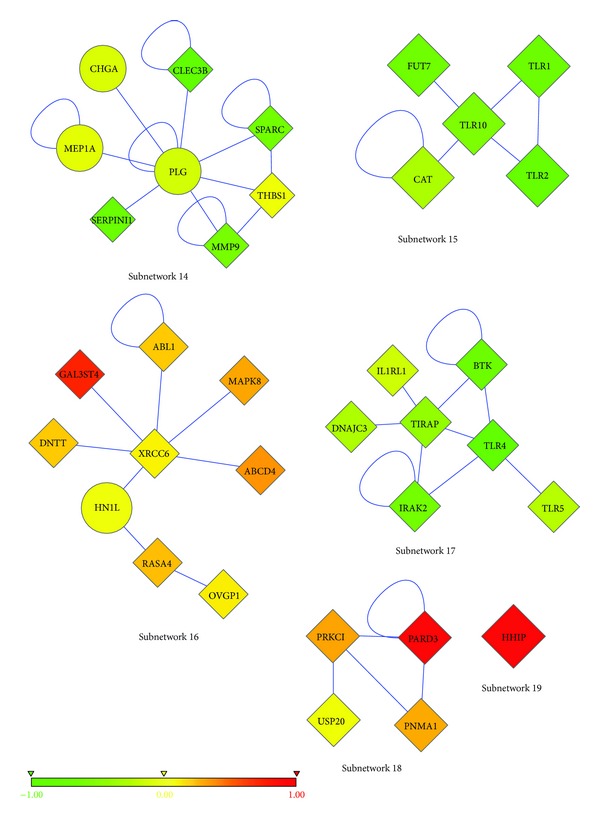
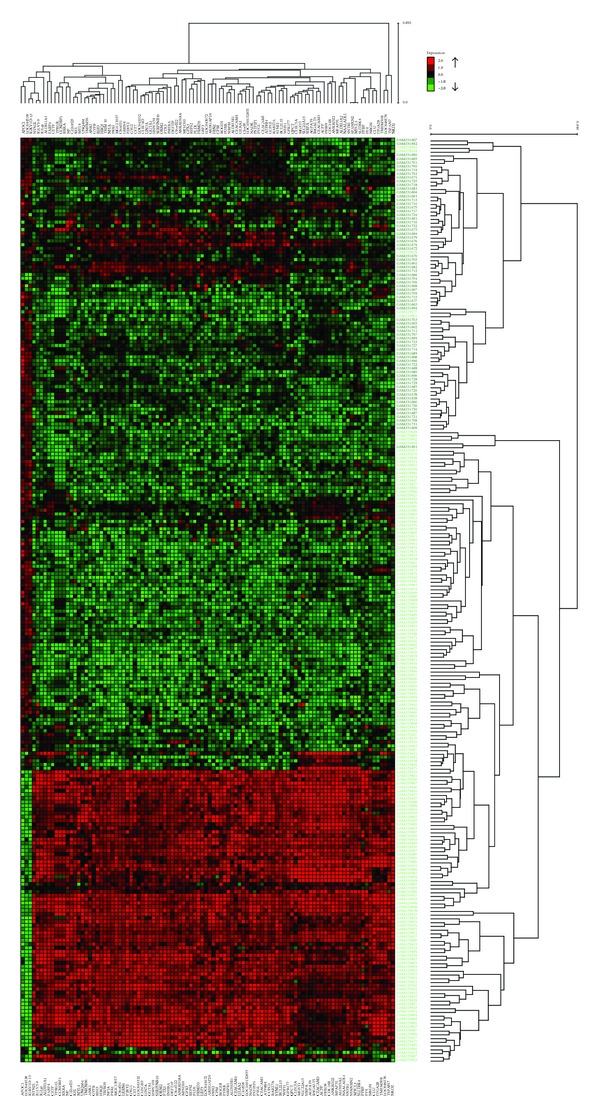
T-cell acute lymphoblastic leukemia (T-ALL) is a complex disease, resulting from proliferation of differentially arrested immature T cells. The molecular mechanisms and the genes involved in the generation of T-ALL remain largely undefined. In this study, we propose a set of genes to differentiate individuals with T-ALL from the nonleukemia/healthy ones and genes that are not differential themselves but interconnected with highly differentially expressed ones. We provide new suggestions for pathways involved in the cause of T-ALL and show that network-based classification techniques produce fewer genes with more meaningful and successful results than expression-based approaches. We have identified 19 significant subnetworks, containing 102 genes. The classification/prediction accuracies of subnetworks are considerably high, as high as 98%. Subnetworks contain 6 nondifferentially expressed genes, which could potentially participate in pathogenesis of T-ALL. Although these genes are not differential, they may serve as biomarkers if their loss/gain of function contributes to generation of T-ALL via SNPs. We conclude that transcription factors, zinc-ion-binding proteins, and tyrosine kinases are the important protein families to trigger T-ALL. These potential disease-causing genes in our subnetworks may serve as biomarkers, alternative to the traditional ones used for the diagnosis of T-ALL, and help understand the pathogenesis of the disease.
Figures
Similar articles
-
Placing ion channels into a signaling network of T cells: from maturing thymocytes to healthy T lymphocytes or leukemic T lymphoblasts.Biomed Res Int. 2015;2015:750203. doi: 10.1155/2015/750203. Epub 2015 Mar 19. Biomed Res Int. 2015. PMID: 25866806 Free PMC article. Review.
-
Identification of new markers discriminating between myeloid and lymphoid acute leukemia.Hematology. 2010 Aug;15(4):193-203. doi: 10.1179/102453310X12647083620769. Hematology. 2010. PMID: 20670477
-
TES and SLC40A1 as Potential Biomarkers for Predicting Survival in T-Cell Acute Lymphoblastic Leukemia.Acta Haematol. 2025;148(2):163-179. doi: 10.1159/000539435. Epub 2024 May 28. Acta Haematol. 2025. PMID: 38806013
-
SET-NUP214 fusion in acute myeloid leukemia- and T-cell acute lymphoblastic leukemia-derived cell lines.J Hematol Oncol. 2009 Jan 23;2:3. doi: 10.1186/1756-8722-2-3. J Hematol Oncol. 2009. PMID: 19166587 Free PMC article.
-
The role of micro-ribonucleic acids in normal hematopoiesis and leukemic T-lymphogenesis.Braz J Med Biol Res. 2010 Jul;43(7):619-26. doi: 10.1590/s0100-879x2010007500057. Epub 2010 Jun 11. Braz J Med Biol Res. 2010. PMID: 20549139 Review.
Cited by
-
Identifying new targets in leukemogenesis using computational approaches.Saudi J Biol Sci. 2015 Sep;22(5):610-22. doi: 10.1016/j.sjbs.2015.01.012. Epub 2015 Jan 20. Saudi J Biol Sci. 2015. PMID: 26288567 Free PMC article.
-
Towards integrated oncogenic marker recognition through mutual information-based statistically significant feature extraction: an association rule mining based study on cancer expression and methylation profiles.Quant Biol. 2017 Dec;5(4):302-327. doi: 10.1007/s40484-017-0119-0. Epub 2017 Nov 23. Quant Biol. 2017. PMID: 30221015 Free PMC article.
-
Placing ion channels into a signaling network of T cells: from maturing thymocytes to healthy T lymphocytes or leukemic T lymphoblasts.Biomed Res Int. 2015;2015:750203. doi: 10.1155/2015/750203. Epub 2015 Mar 19. Biomed Res Int. 2015. PMID: 25866806 Free PMC article. Review.
-
Self-Contained Statistical Analysis of Gene Sets.PLoS One. 2016 Oct 6;11(10):e0163918. doi: 10.1371/journal.pone.0163918. eCollection 2016. PLoS One. 2016. PMID: 27711232 Free PMC article.
-
Altered expression and functional role of ion channels in leukemia: bench to bedside.Clin Transl Oncol. 2020 Mar;22(3):283-293. doi: 10.1007/s12094-019-02147-2. Epub 2019 Jul 6. Clin Transl Oncol. 2020. PMID: 31280433 Review.
References
-
- Graux C, Cools J, Michaux L, Vandenberghe P, Hagemeijer A. Cytogenetics and molecular genetics of T-cell acute lymphoblastic leukemia: from thymocyte to lymphoblast. Leukemia. 2006;20(9):1496–1510. - PubMed
-
- Van Vlierberghe P, Pieters R, Beverloo HB, Meijerink JPP. Molecular-genetic insights in paediatric T-cell acute lymphoblastic leukaemia. British Journal of Haematology. 2008;143(2):153–168. - PubMed
-
- Aifantis I, Raetz E, Buonamici S. Molecular pathogenesis of T-cell leukaemia and lymphoma. Nature Reviews Immunology. 2008;8(5):380–390. - PubMed
-
- Staal FJT, Langerak AW. Signaling pathways involved in the development of T-cell acute lymphoblastic leukemia. Haematologica. 2008;93(4):493–497. - PubMed
-
- Ferrando AA, Neuberg DS, Staunton J, et al. Gene expression signatures define novel oncogenic pathways in T cell acute lymphoblastic leukemia. Cancer Cell. 2002;1(1):75–87. - PubMed
Publication types
MeSH terms
Substances
LinkOut - more resources
Full Text Sources
Other Literature Sources
