

Oxidative stress leads to increased mutation frequency in a murine model of myelodysplastic syndrome
- PMID: 23958061
- PMCID: PMC3872269
- DOI: 10.1016/j.leukres.2013.07.008
Oxidative stress leads to increased mutation frequency in a murine model of myelodysplastic syndrome
Abstract
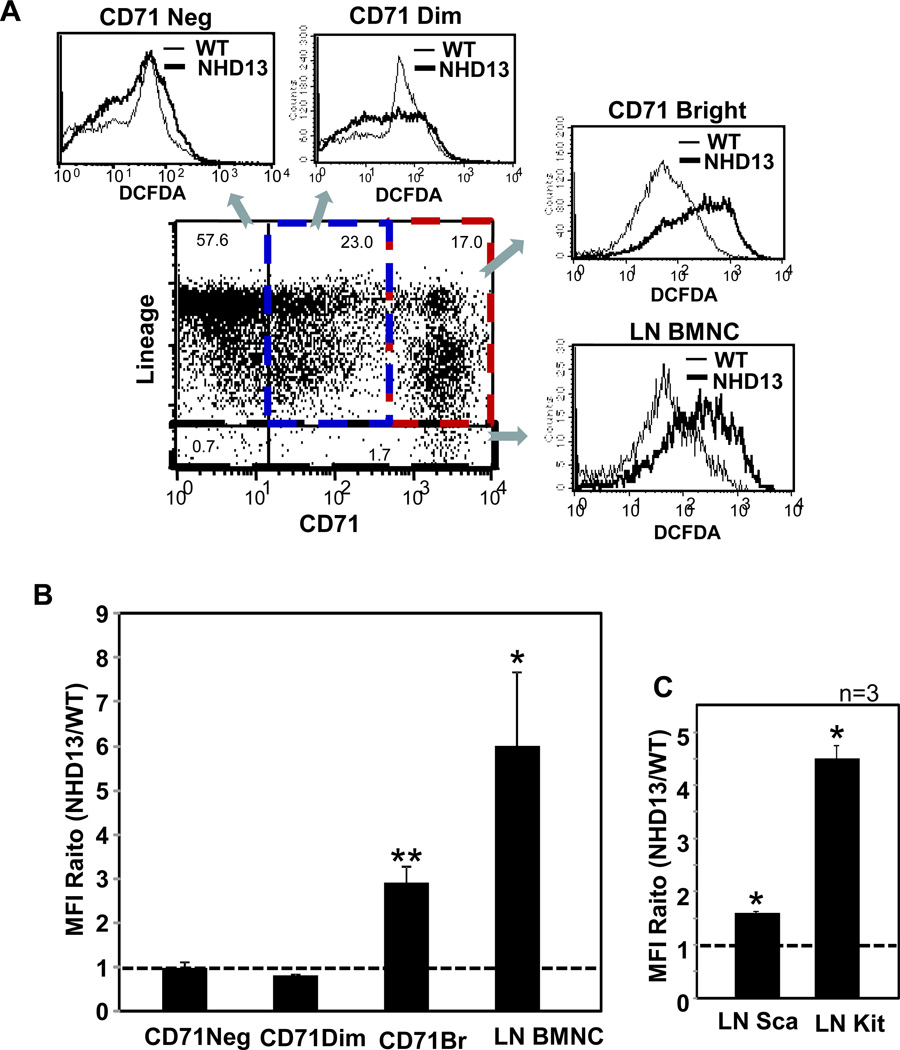
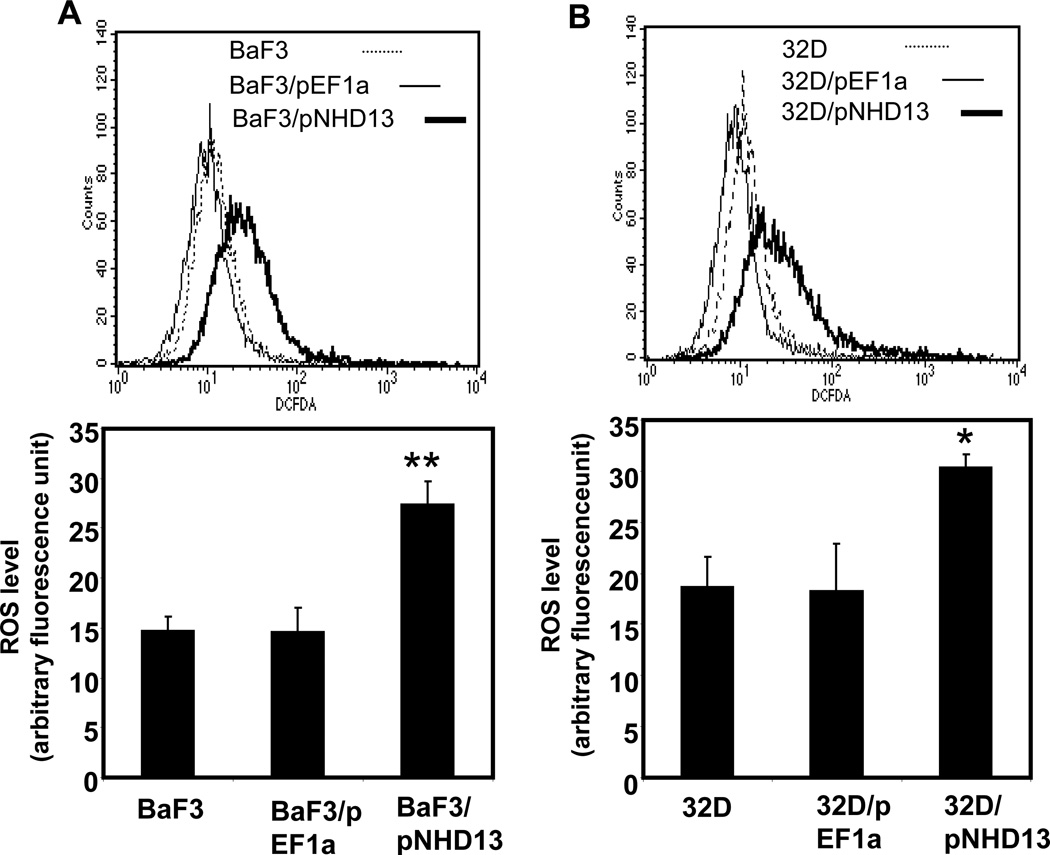
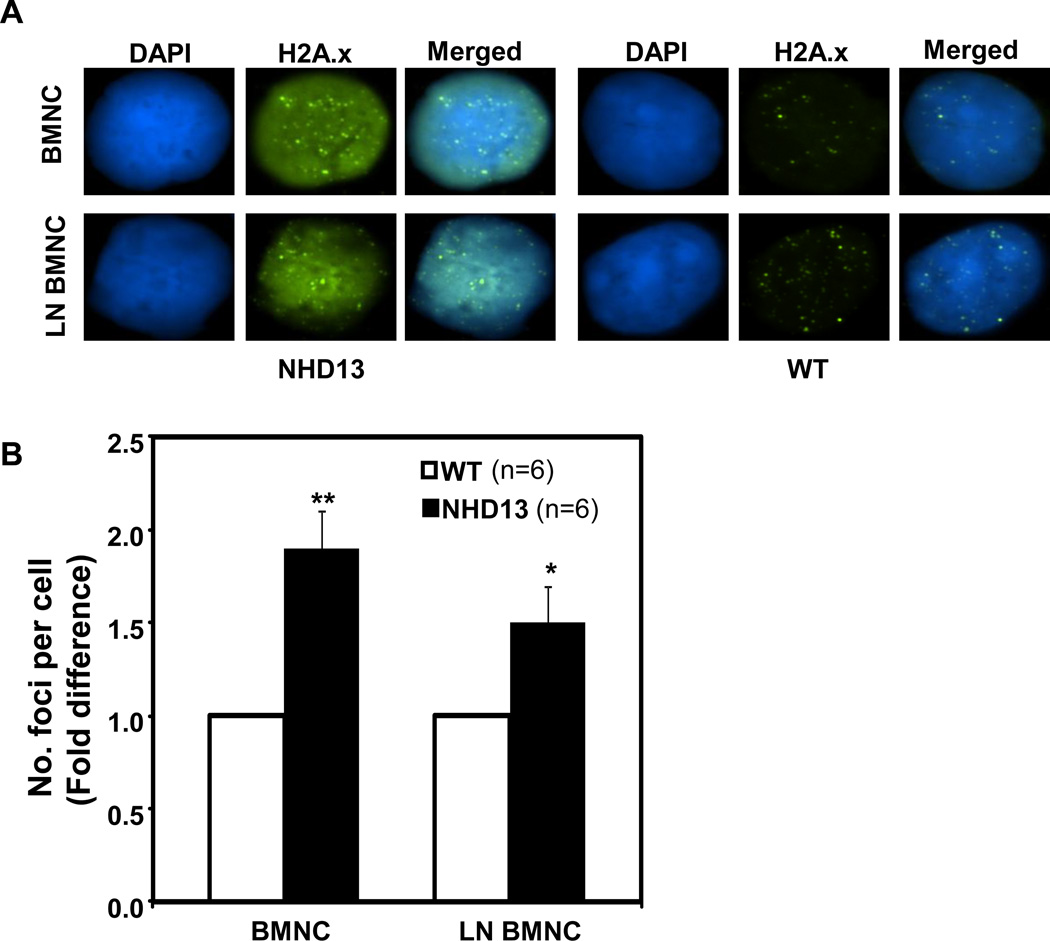
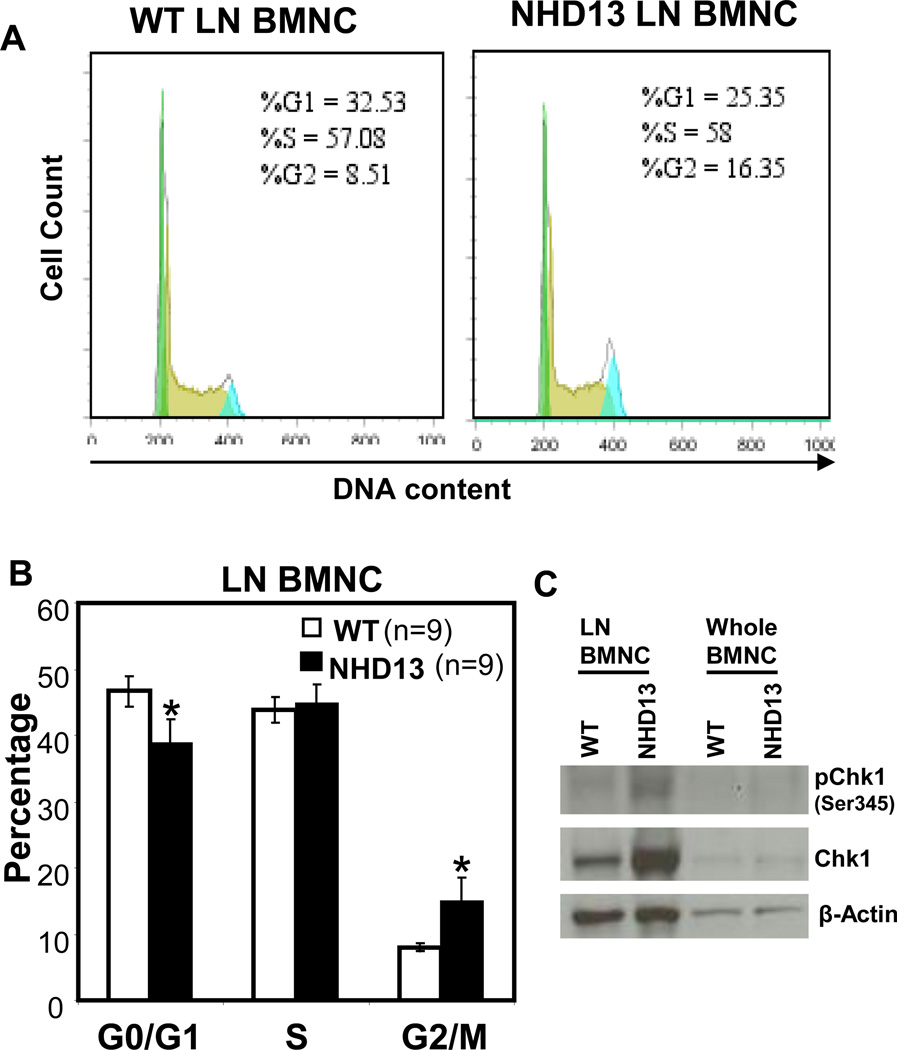
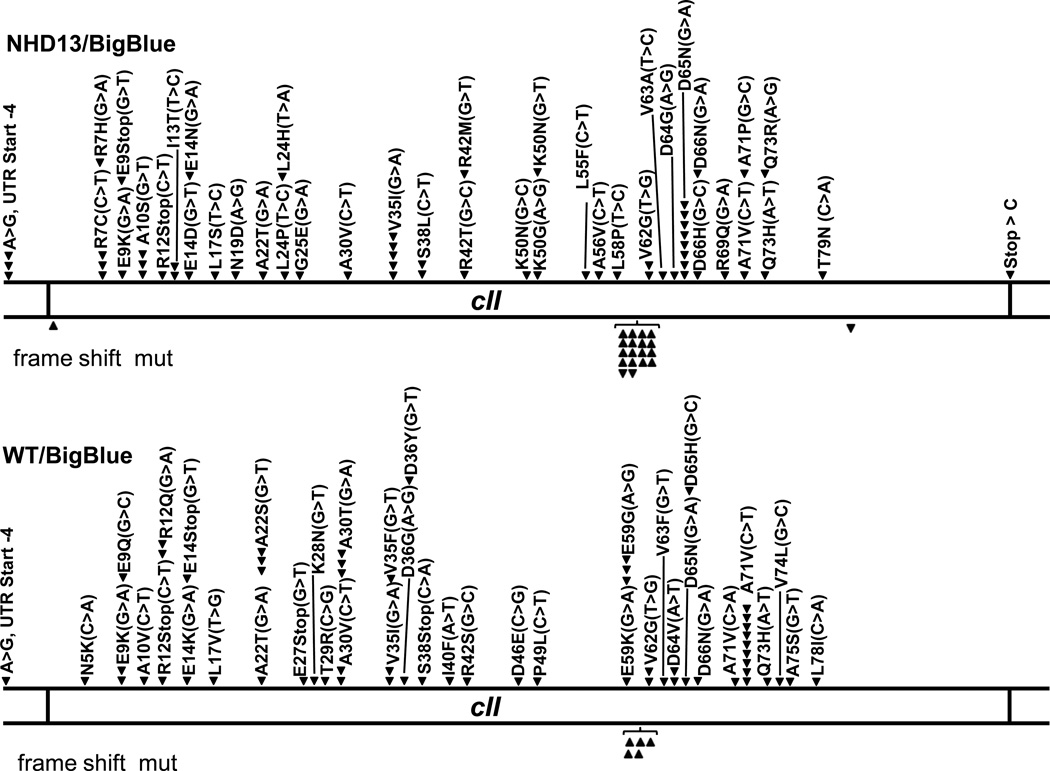
The myelodysplastic syndromes (MDS) are characterized by ineffective hematopoiesis, dysplasia, and transformation to acute myeloid leukemia (AML). Although it has been suggested that additional mutations lead to progression of MDS to AML, the causative agent(s) for such mutations remains unclear. Oxidative stress is a potential cause, therefore, we evaluated levels of reactive oxygen species (ROS) in NUP98-HOXD13 (NHD13) transgenic mice, a murine model for MDS. Increased levels of ROS were detected in bone marrow nucleated cells (BMNC) that express CD71, a marker for cell proliferation, as well as immature, lineage negative bone marrow nucleated cells from NHD13 mice. In addition to the increase in ROS, increased DNA double strand breaks and activation of a G2/M phase cell cycle checkpoint were noted in NHD13 BMNC. Finally, using an in vivo assay for mutation frequency, we detected an increased mutation frequency in NHD13 BMNC. These results suggest that oxidative stress may contribute to disease progression of MDS to AML through ineffective repair of DNA damage and acquisition of oncogenic mutations.
Keywords: AML; Big Blue(®) mice; MDS; Mutation; NHD13; ROS.
Published by Elsevier Ltd.
Conflict of interest statement
The authors declare that there are no conflicts of interest.
Figures
Similar articles
-
Depletion of cytotoxic T-cells does not protect NUP98-HOXD13 mice from myelodysplastic syndrome but reveals a modest tumor immunosurveillance effect.PLoS One. 2012;7(5):e36876. doi: 10.1371/journal.pone.0036876. Epub 2012 May 11. PLoS One. 2012. PMID: 22606303 Free PMC article.
-
NUP98-HOX translocations lead to myelodysplastic syndrome in mice and men.J Natl Cancer Inst Monogr. 2008;(39):64-8. doi: 10.1093/jncimonographs/lgn014. J Natl Cancer Inst Monogr. 2008. PMID: 18648006 Free PMC article.
-
Inhibition of apoptosis by BCL2 prevents leukemic transformation of a murine myelodysplastic syndrome.Blood. 2012 Sep 20;120(12):2475-83. doi: 10.1182/blood-2012-05-430736. Epub 2012 Jul 31. Blood. 2012. PMID: 22855610 Free PMC article.
-
High Expression of Human Homologue of Murine Double Minute 4 and the Short Splicing Variant, HDM4-S, in Bone Marrow in Patients With Acute Myeloid Leukemia or Myelodysplastic Syndrome.Clin Lymphoma Myeloma Leuk. 2016 Aug;16 Suppl:S30-8. doi: 10.1016/j.clml.2016.03.012. Epub 2016 Apr 1. Clin Lymphoma Myeloma Leuk. 2016. PMID: 27155969 Review.
-
Molecular pathways mediating MDS/AML with focus on AML1/RUNX1 point mutations.J Cell Physiol. 2009 Jul;220(1):16-20. doi: 10.1002/jcp.21769. J Cell Physiol. 2009. PMID: 19334039 Review.
Cited by
-
Role of reactive oxygen species in myelodysplastic syndromes.Cell Mol Biol Lett. 2024 Apr 14;29(1):53. doi: 10.1186/s11658-024-00570-0. Cell Mol Biol Lett. 2024. PMID: 38616283 Free PMC article. Review.
-
Effect of Diet and Oxidative Stress in the Pathogenesis of Lymphoproliferative Disorders.Antioxidants (Basel). 2023 Aug 26;12(9):1674. doi: 10.3390/antiox12091674. Antioxidants (Basel). 2023. PMID: 37759977 Free PMC article. Review.
-
The Simultaneous Elevation of Oxidative Stress Markers and Wilms' Tumor 1 Gene during the Progression of Myelodysplastic Syndrome.Intern Med. 2016;55(24):3661-3664. doi: 10.2169/internalmedicine.55.7156. Epub 2016 Dec 15. Intern Med. 2016. PMID: 27980269 Free PMC article.
-
Protein Carbonylation and Lipid Peroxidation in Hematological Malignancies.Antioxidants (Basel). 2020 Dec 1;9(12):1212. doi: 10.3390/antiox9121212. Antioxidants (Basel). 2020. PMID: 33271863 Free PMC article. Review.
-
In vitro and in vivo assessment of indomethacin-induced genotoxicity: protection by curcumin.Res Pharm Sci. 2024 Apr 1;19(2):178-187. doi: 10.4103/RPS.RPS_100_23. eCollection 2024 Apr. Res Pharm Sci. 2024. PMID: 39035581 Free PMC article.
References
-
- Rassool FV, Gaymes TJ, Omidvar N, Brady N, Beurlet S, Pla M, et al. Reactive oxygen species, DNA damage, and error-prone repair: a model for genomic instability with progression in myeloid leukemia? Cancer research. 2007;67:8762–8771. - PubMed
-
- Mijovic A, Mufti GJ. The myelodysplastic syndromes: towards a functional classification. Blood reviews. 1998;12:73–83. - PubMed
-
- Gilliland DG, Tallman MS. Focus on acute leukemias. Cancer cell. 2002;1:417–420. - PubMed
-
- Heaney ML, Golde DW. Myelodysplasia. The New England journal of medicine. 1999;340:1649–1660. - PubMed
Publication types
MeSH terms
Substances
Grants and funding
LinkOut - more resources
Full Text Sources
Other Literature Sources
Medical
Research Materials
Miscellaneous
