Review
. 2014 Jun 15;75(12):961-9.
doi: 10.1016/j.biopsych.2013.07.015. Epub 2013 Aug 16.

The genome in three dimensions: a new frontier in human brain research

Affiliations
Review

The genome in three dimensions: a new frontier in human brain research

Amanda C Mitchell et al. Biol Psychiatry. .

Abstract

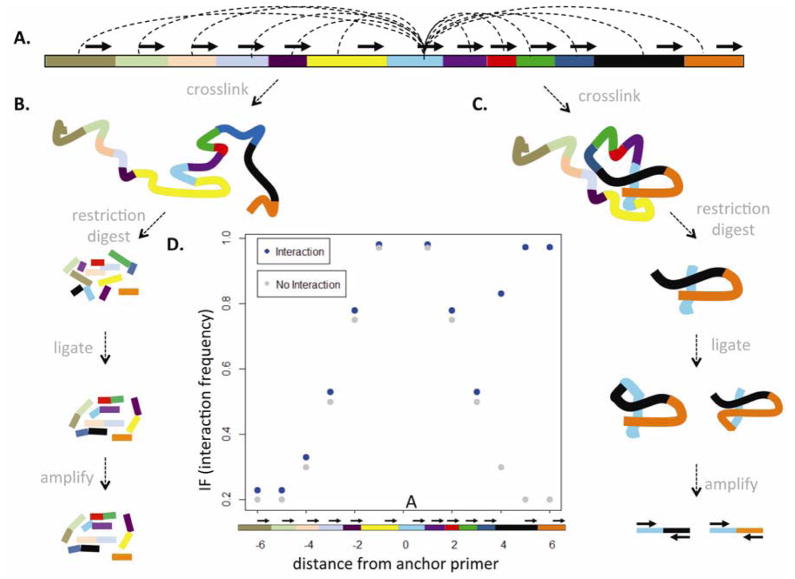
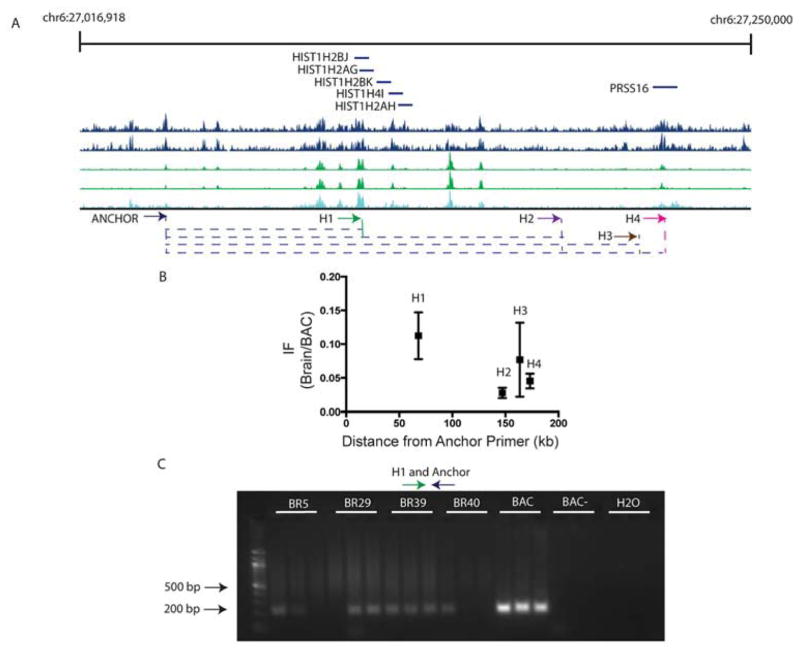
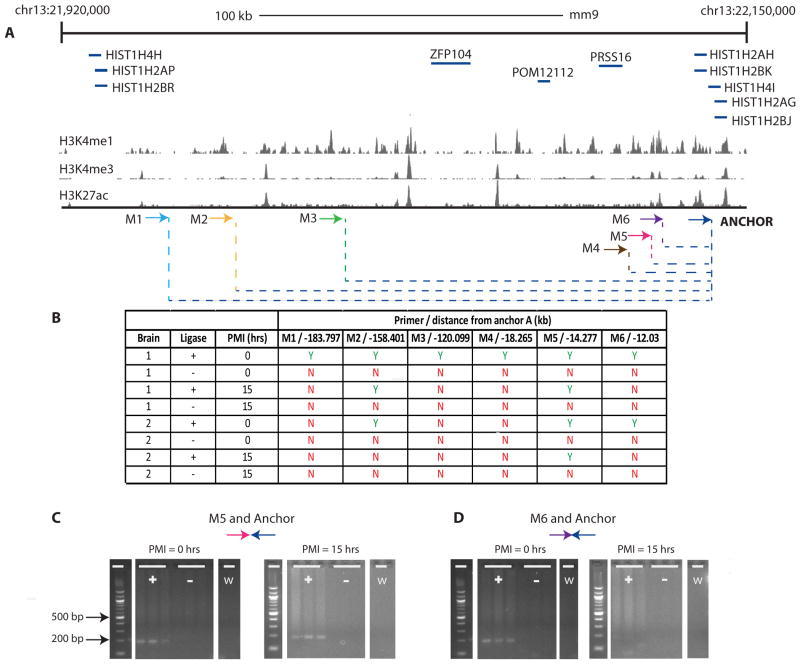
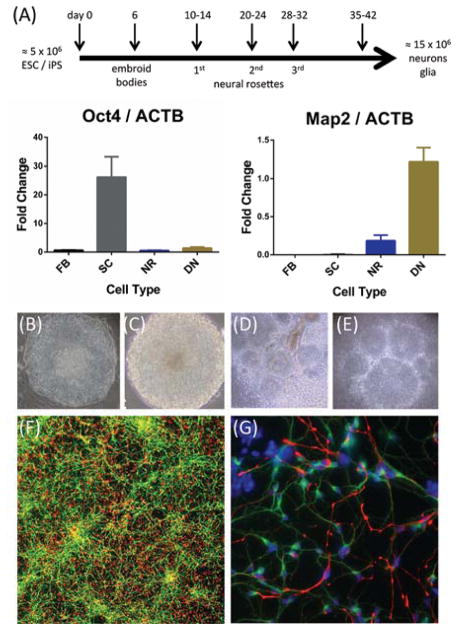
Less than 1.5% of the human genome encodes protein. However, vast portions of the human genome are subject to transcriptional and epigenetic regulation, and many noncoding regulatory DNA elements are thought to regulate the spatial organization of interphase chromosomes. For example, chromosomal "loopings" are pivotal for the orderly process of gene expression, by enabling distal regulatory enhancer or silencer elements to directly interact with proximal promoter and transcription start sites, potentially bypassing hundreds of kilobases of interspersed sequence on the linear genome. To date, however, epigenetic studies in the human brain are mostly limited to the exploration of DNA methylation and posttranslational modifications of the nucleosome core histones. In contrast, very little is known about the regulation of supranucleosomal structures. Here, we show that chromosome conformation capture, a widely used approach to study higher-order chromatin, is applicable to tissue collected postmortem, thereby informing about genome organization in the human brain. We introduce chromosome conformation capture protocols for brain and compare higher-order chromatin structures at the chromosome 6p22.2-22.1 schizophrenia and bipolar disorder susceptibility locus, and additional neurodevelopmental risk genes, (DPP10, MCPH1) in adult prefrontal cortex and various cell culture systems, including neurons derived from reprogrammed skin cells. We predict that the exploration of three-dimensional genome architectures and function will open up new frontiers in human brain research and psychiatric genetics and provide novel insights into the epigenetic risk architectures of regulatory noncoding DNA.

Keywords: Chromatin fiber; chromosomal looping; chromosome conformation capture; genome in 3D; higher-order chromatin; human brain.


Conflict of interest statement

Authors report no biomedical financial interests or potential conflicts of interest.

Figures

Figure 1
Figure 1. Chromosome conformation capture
(A) For 3C assays, primers (represented as arrows) are designed within 30 base pairs of the restriction fragments (shown as colored rectangles). For 3C interactions in cis (same chromosome), primers typically are placed in 5′ to 3′ orientation along the same DNA strand to detect looping interactions. Typically the first primer is in a fixed position and the 3C assays are anchored to that specific restriction fragment (light blue in A) and interactions are tested with a set of second primers, each from a different fragment positioned at increasing distances from the anchor. (B) (C) Hypothetical chromosome without (B) or with (C) a loop formation. Theoretically, only (C) will result in PCR product from non-contiguous DNA elements with the anchor. (D) Hypothetical outcome from a typical 3C experiment, revealing in the absence of a loop formation (‘no interaction’) exponentially declining 3C product intensity with increasing distance from the anchor (A, fragment 0). In contrast, there is a robust interaction between the anchor and the more distal fragment (black/brown fragments 5, 6) in chromosome with loop formation.
Figure 2
Figure 2. Human frontal cortex 3C in the chromosome 6 MHC II schizophrenia risk locus
(A) 3C interactions were investigated across a 250kb region on human chr6:27,016,918–27,250,000 (human genome assembly hg19), including a histone gene cluster (HIST) and the PRSS16 gene. Browser tracks show landscapes for frontal cortex (from top to bottom: H3K4me1 Brain 1, H3K4me1 Brain 2, H3K4me3 Brain 1, H3K4me3 Brain 2, H3K27ac Brain 1) (72). 3C primers (H1, H2, H3, and H4) were designed to interrogate interactions with anchor primer (‘ANCHOR’) at schizophrenia risk SNP rs6904071. (B) Interaction frequencies (IF) of non-contiguous DNA elements in frontal cortex (N= 4, mean ± S.E.M. after normalization to BAC control), showing a strong tendency for site-specific interactions with Anchor primer (One-way ANOVA P = 0.06). (C) Representative agarose gel from 3C-PCR, showing 221 bp product of H1:Anchor primers in 4 adult frontal cortex specimens (Brain (BR) no.5, 29, 39 and 40) with postmortem intervals ranging from 12–27 hours, a 3C library from a BAC with (BAC) and without (BAC-) the ligase treatment, and water control.
Figure 3
Figure 3. Stability of 3C signal in postmortem brain
(A) 3C interactions from mouse cerebral cortex were investigated across 230kb of chr13:21,920,000–22,150,000 (mouse genome assembly mm9), which includes the murine homologue to human chromosome 6 MHC II region shown in Figure 2. Adult mouse cortex H3K4me1, H3K4me3, and H3K27ac landscapes are from (17, 62). Mouse 3C primers (M1, M2, M3, M4, M5, and M6) and Anchor primer at HIST1H4I in the histone gene cluter (B) Summary table of 3C interactions from cerebral cortex of two mouse brains, with one hemisphere processed at time of brain harvest and one hemisphere subjected to 15 hours autolysis time at room temperature. Notice that consistent amplification both at 0 and 15 hrs postmortem interval is limited to a primer M5. Notice lack of 3C PCR product in all samples when DNA ligase is omitted from 3C assays, confirming that positive product from (ligase-treated) 3C assays reflect physical interaction of the non-contiguous DNA elements. (C, D) Representative 3C-PCR agarose gels showing products (approximately 200bp) between Anchor and (C) M5, (D) M6 primers from cortical hemisphere with (left) 0 and (right) 15 hours PMI, with (+) and without (−) DNA ligase in 3C assay. Notice lack of detectable product in all (−) and water (w) controls. Notice weaker 3C PCR product after 15 hours of tissue autolysis, particularly for M6 primer.
Figure 4
Figure 4. Modeling higher order chromatin of brain cells in the cell culture dish
(A) Time line summarizing the generation of > 1.5 × 10⁷ cells with at least 50% MAP2 immunoreactive neurons in a mixed culture over the course of 35–42 days, from 5 × 10⁶ pluripotent embryonic stem cells (ESC) or induced pluripotent stem cell s(iPS) as starting material, with intermediate steps of embroid bodies and cultures of primary, seconday and tertiary neural rosettes. The bar graphs display RNA expression of pluripotency marker Oct4 (left) and neuronal marker (MAP2) (fight) normalized to -actin in fibroblasts (FB), embryonic stem cells (SC), neural rosettes (NR), and differentiated neurons (DN). Data shown as mean ± S.D. (N=5 independent experiments). Octamer binding transcription factor 4 (OCT4) and microtubule associated protein 2 (MAP2) expression were quantified in fibroblasts (FB), embryonic stem cells (SC), neural rosettes (NR), and differentiated neurons (DN). The OCT4 forward primer (OCT4-F), GTATTCAGCCAAACGACCATCT, OCT4 reverse primer CGATACTGGTTCGCTTTCTCTT. The MAP2 forward primer CCACCTGAGATTAAGGATCA, reverse (MAP2-R) GGCTTACTTTGCTTCTCTGA. -actin (ACTB) forward primer ACCATGGATGATGATATCGC reverses (hACTB-R) TCATTGTAGAAGGTGTGGTG. Representative examples of (B) H9 human ESC colony, (C) embroid body grown in neural induction media; (D) neural rosettes forming after 4 days, plated in laminin and grown in neural induction media; (E) neural rosettes expanding after collection and replating on laminin (F) MAP2 immunoreactive neurons (green) intermingled with Nestin positive precursor cells (red) differentiated from H9ESC (G) Representative image of MAP2+ (green) neurons from skin fibroblast-derived iPS, intermingled with Nestin-positive precursors (red), differentiated from iPS and other cells. Images in (F)(G) taken with 50x (200x) magnification.

References

    1. Houston I, Peter CJ, Mitchell A, Straubhaar J, Rogaev E, Akbarian S. Epigenetics in the human brain. Neuropsychopharmacology : official publication of the American College of Neuropsychopharmacology. 2013;38:183–197. - PMC - PubMed
    1. Telese F, Gamliel A, Skowronska-Krawczyk D, Garcia-Bassets I, Rosenfeld MG. “Seq-ing” Insights into the Epigenetics of Neuronal Gene Regulation. Neuron. 2013;77:606–623. - PMC - PubMed
    1. Ku CS, Naidoo N, Wu M, Soong R. Studying the epigenome using next generation sequencing. Journal of medical genetics. 2011;48:721–730. - PubMed
    1. Maze I, Noh KM, Allis CD. Histone regulation in the CNS: basic principles of epigenetic plasticity. Neuropsychopharmacology : official publication of the American College of Neuropsychopharmacology. 2013;38:3–22. - PMC - PubMed
    1. Maze I, Feng J, Wilkinson MB, Sun H, Shen L, Nestler EJ. Cocaine dynamically regulates heterochromatin and repetitive element unsilencing in nucleus accumbens. Proceedings of the National Academy of Sciences of the United States of America. 2011;108:3035–3040. - PMC - PubMed

Publication types