. 2013 Aug 19:11:60.
doi: 10.1186/1478-811X-11-60.

Early innate immunity determines outcome of Mycobacterium tuberculosis pulmonary infection in rabbits

Early innate immunity determines outcome of Mycobacterium tuberculosis pulmonary infection in rabbits

Selvakumar Subbian et al. Cell Commun Signal. .

Abstract

Background: Pulmonary infection of humans by Mycobacterium tuberculosis (Mtb), the causative agent of tuberculosis (TB), results in active disease in 5-10% of individuals, while asymptomatic latent Mtb infection (LTBI) is established in the remainder. The host immune responses that determine this differential outcome following Mtb infection are not fully understood. Using a rabbit model of pulmonary TB, we have shown that infection with the Mtb clinical isolate HN878 (a hyper-virulent W-Beijing lineage strain) leads to progressive cavitary disease similar to what is seen in humans with active TB. In contrast, infection with Mtb CDC1551 (a hyper-immunogenic clinical isolate) is efficiently controlled in rabbit lungs, with establishment of LTBI, which can be reactivated upon treatment with immune-suppressive drugs. We hypothesize that the initial interaction of Mtb with the cells of the host response in the lungs determine later outcome of infection.

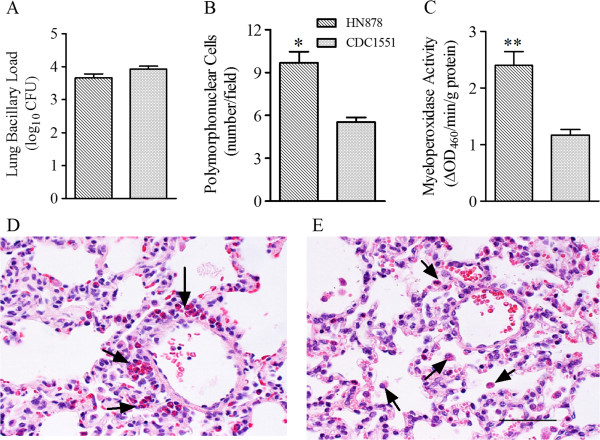
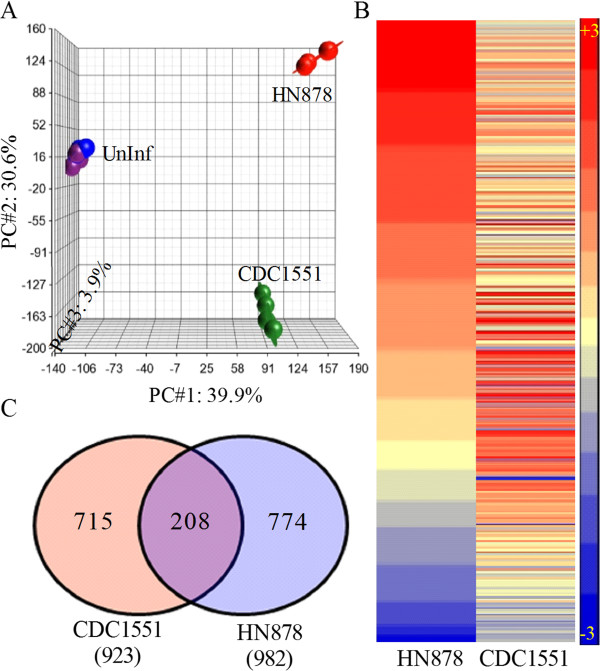
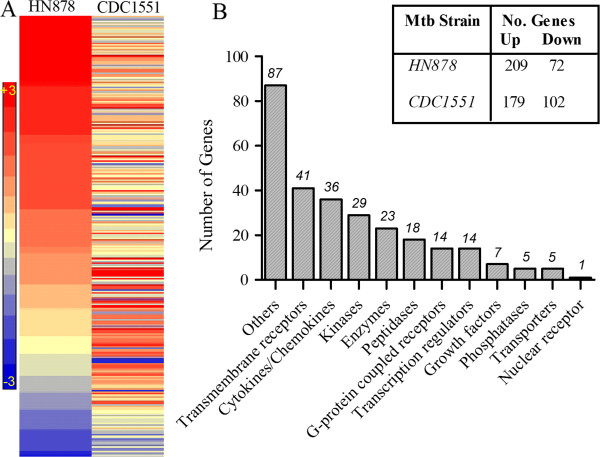
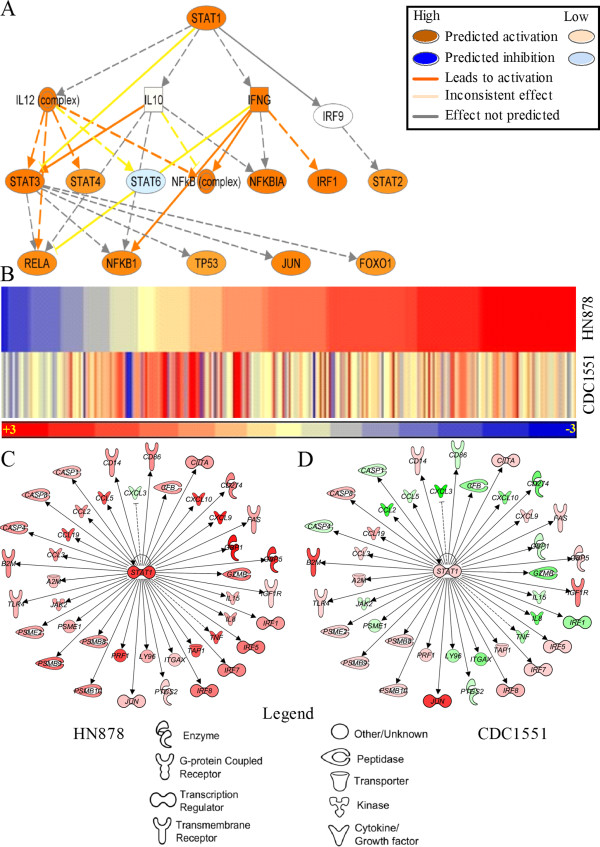
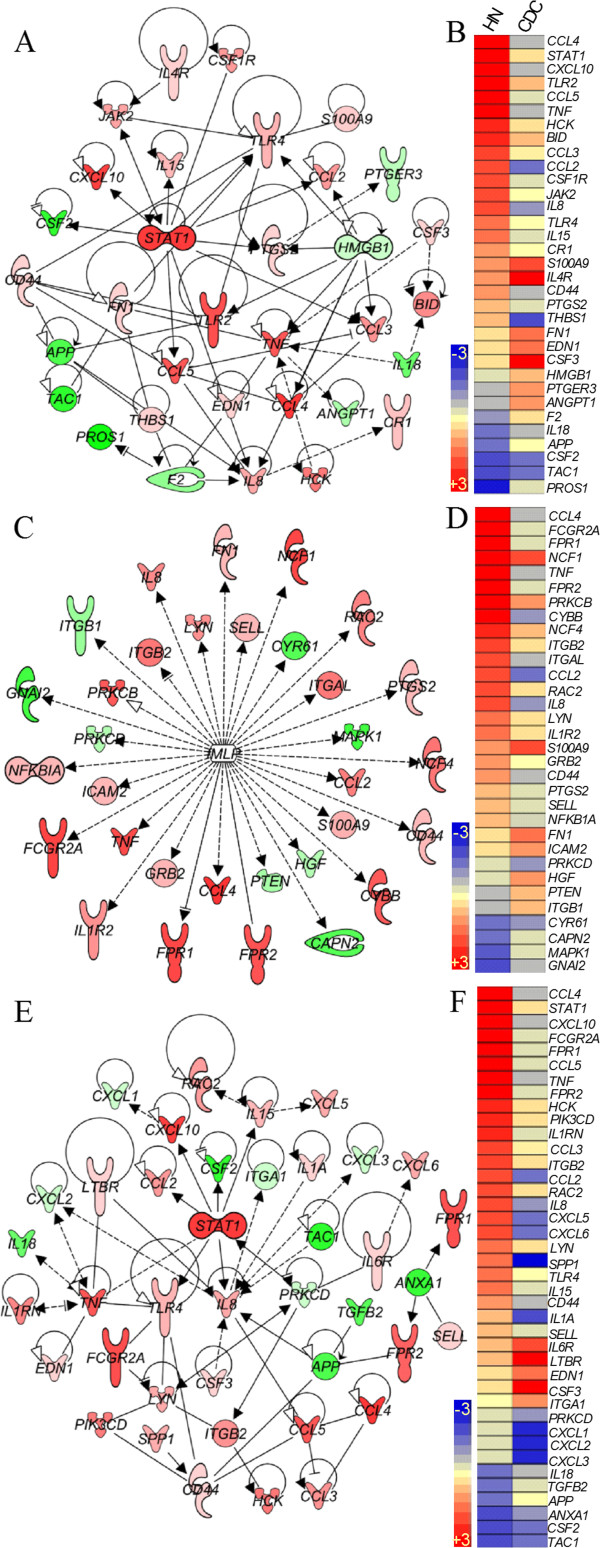
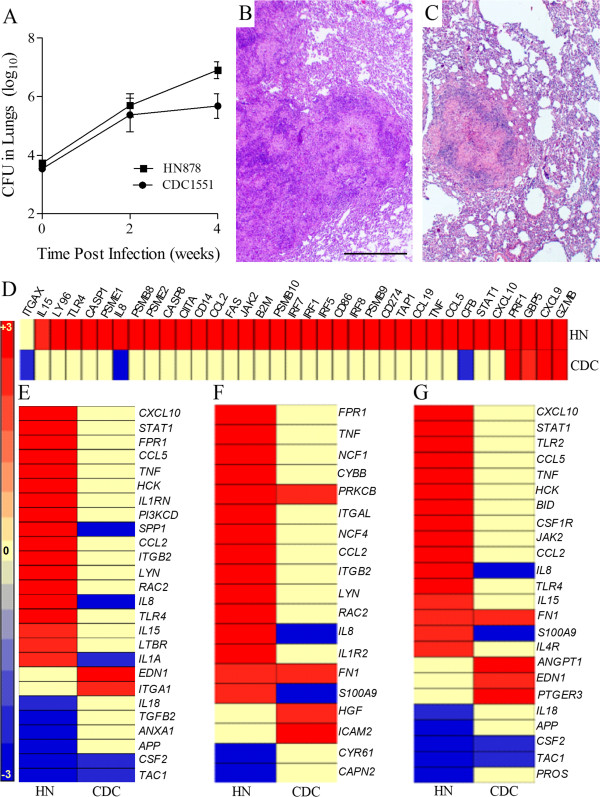
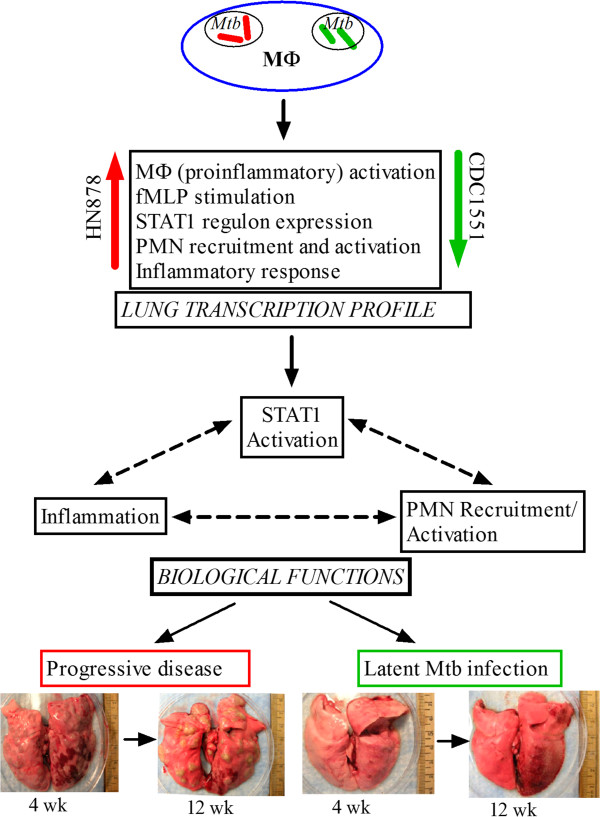
Results: To test this hypothesis, we used our rabbit model of pulmonary TB and infected the animals with Mtb HN878 or CDC1551. At 3 hours, with similar lung bacillary loads, HN878 infection caused greater accumulation of mononuclear and polymorphonuclear leukocytes (PMN) in the lungs, compared to animals infected with CDC1551. Using whole-genome microarray gene expression analysis, we delineated the early transcriptional changes in the lungs of HN878- or CDC1551-infected rabbits at this time and compared them to the differential response at 4 weeks of Mtb-infection. Our gene network and pathway analysis showed that the most significantly differentially expressed genes involved in the host response to HN878, compared to CDC1551, at 3 hours of infection, were components of the inflammatory response and STAT1 activation, recruitment and activation of macrophages, PMN, and fMLP (N-formyl-Methionyl-Leucyl-Phenylalanine)-stimulation. At 4 weeks, the CDC1551 bacillary load was significantly lower and the granulomatous response reduced compared to HN878 infection. Moreover, although inflammation was dampened in both Mtb infections at 4 weeks, the majority of the differentially expressed gene networks were similar to those seen at 3 hours.

Conclusions: We propose that differential regulation of the inflammation-associated innate immune response and related gene expression changes seen at 3 hours determine the long term outcome of Mtb infection in rabbit lungs.


Figures

Figure 1
Figure 1
Bacillary load, accumulation of activated PMN in Mtb-infected rabbit lungs. (A) Total lung bacillary load in Mtb HN878- or CDC1551-infected rabbits at 3 hours post-infection. The values plotted are mean ± standard deviation from four animals per group (B) Numbers of polymorphonuclear (PMN) cells in the lungs of Mtb HN878- or CDC1551-infected rabbits at 3 hours post-infection. The values plotted are mean ± standard deviation (C). Levels of myeloperoxidase (MPO) activity used to determine the activation status of PMNs. MPO activity was measured calorimetrically in the lung homogenates of Mtb HN878- or CDC1551-infected rabbits at 3 hours post-infection and reported as change in OD460 / min / g protein. The values plotted are mean ± standard deviation from triplicate assays from 3 animals per group. (D and E) Representative lung section histology of Mtb HN878- (D) or CDC1551- (E) infected rabbits at 3 hour post-infection stained with H&E and photographed at 400x magnification. Arrows point to PMNs. These cells in the rabbit contain red granules when stained with H&E and are known as heterophils. The scale bar (50 μM) is same for (D) and (E).
Figure 2
Figure 2
Genome-wide rabbit lung transcriptome and profile of significantly differentially expressed genes (SDEG) at 3 hours post-Mtb-infection. (A). Principal component analysis (PCA) of microarray gene expression datasets from uninfected, Mtb HN878- or CDC1551-infected rabbit lungs at 3 hours. The elliptical line around each data point represents the standard deviation from the median. (B). Intensity plot of SDEG in rabbit lungs following HN878 or CDC1551 infection at 3 hours. Gene expression values were sorted in a descending fashion for the HN878 dataset. The color scale ranges from +3 (red; upregulation) to −3 (blue; downregulation) (C). Venn diagram showing the number of genes obtained from pair wise comparison between uninfected and Mtb HN878- or CDC1551-infected animals.
Figure 3
Figure 3
Expression of inflammatory response network genes in Mtb-infected rabbit lungs. (A). Intensity plot of 281 SDEG involved in inflammatory response network in the HN878- or CDC1551-infected rabbit lungs at 3 hours. The color scale ranges from +3 (red; upregulation) to −3 (blue; downregulation) (B). Functional classification of inflammatory response network genes. Numbers on top of each bar refer to subsets of genes in each functional category. The top right table shows the number of up and down regulated SDEG by Mtb HN878 or CDC1551 infection of rabbit lungs at 3 hours.
Figure 4
Figure 4
Interaction and expression pattern of canonical STAT1 mechanistic pathway genes and STAT1 interaction network genes in Mtb-infected rabbit lungs. (A) STAT1 regulation of downstream transcriptional regulators. Solid arrows indicate direct and broken arrow indicates indirect interactions. Predictions on the direction and intensity of activation and inhibition by STAT1 were made by IPA knowledgebase based on published literature. (B) Intensity plot of 260 SDEG involved in canonical STAT1 mechanistic pathway in HN878- or CDC1551-infected rabbit lungs at 3 hours. The color scale ranges from +3 (red; upregulation) to −3 (blue; downregulation). (C and D) Interaction of STAT1 network genes in HN878- (C) or CDC1551- (D) infected rabbit lungs at 3 hours. Solid lines indicate direct interactions and broken lines denote indirect interactions of genes. For (C) and (D), gene symbols in red are up and green are down regulated. The color gradient of the gene symbols is proportional to their relative expression levels.
Figure 5
Figure 5
Gene expression pattern and interaction in networks involved in macrophage activation (A and B), fMLP-stimulation (C and D) or PMN recruitment and activation (E and F) in the lungs of Mtb-infected rabbits at 3 hours. (A) Interaction of macrophage activation network genes in the HN878-infected rabbit lungs. (B) Intensity plot of macrophage activation network genes in the Mb-infected rabbit lungs. (C) Interaction among genes involved in fMLP-stimulated network in the HN878-infected rabbit lungs. (D) Intensity plot of genes involved in fMLP-stimulated network in Mtb-infected rabbit lungs. (E) Interaction of PMN recruitment and activation network genes in the HN878-infected rabbit lungs. (F) Intensity plot of PMN recruitment and activation network genes in the Mb-infected rabbit lungs. The legend for the gene symbols in (A), (C) and (E) is the same as in Figure 4. Gene symbols in red are up and green are down regulated. The color gradient of the gene symbols is proportional to their relative expression levels. Solid lines indicate direct and broken lines denote indirect interactions. For (B), (D) and (F), the gene expression values were sorted in a descending fashion for the HN878 dataset. The color scale in (B), (D) and (F) ranges from +3 (red) to −3 (blue).
Figure 6
Figure 6
Bacillary load, histology and expression pattern of selected network genes in Mtb-infected rabbit lungs at 4 weeks. (A) Total lung bacillary load in Mtb HN878- or CDC1551-infected rabbits at 4 weeks post-infection. The values plotted are mean ± standard deviation for 3–5 animals per time point. (B) Hematoxylin and Eosin (H&E) stained lung sections of Mtb HN878-infected rabbits at 4 weeks post-infection. (C) H&E stained lung sections of Mtb CDC1551-infected rabbits at 4 weeks post-infection. The scale bar (1 mm) is same for (B) and (C). (D-G) Intensity plots of STAT1 activation (D), macrophage activation (E), fMLP-stimulation (F) and PMN recruitment and activation network genes in the HN878- (HN) or CDC1551- (CDC) infected rabbit lungs at 4 weeks. For (D-G), the gene expression values were sorted in a descending fashion for the HN878 dataset. The color scale ranges from +3 (red) to −3 (blue).
Figure 7
Figure 7
Schematic illustration showing the interaction(s) among components of the early innate immune response at the transcriptional, cellular and organismal level during Mtb infection of rabbit lungs. Transcription profile refers to the microarray gene expression data from HN878- or CDC1551-infected rabbit lungs. The arrows in red (HN878) denote unregulation and those in green (CDC1551) indicate downregulation of pathway genes. Pathogenesis refers to the progression of infection into active disease (HN878) or containment of infection and establishment of latency (CDC1551) in the rabbit lungs at 4 to 12 weeks post-infection.

References

    1. WHO. WHO report: Tuberculosis Fact Sheet 2008. Geneva: World Health Organization; 2008.
    1. Kleinnijenhuis J, Oosting M, Joosten LA, Netea MG, Van Crevel R. Innate immune recognition of Mycobacterium tuberculosis. Clin Dev Immunol. 2011;201(1):405310. - PMC - PubMed
    1. Ramakrishnan L. Revisiting the role of the granuloma in tuberculosis. Nat Rev Immunol. 2012;12(5):352–366. - PubMed
    1. Azad AK, Sadee W, Schlesinger LS. Innate immune gene polymorphisms in tuberculosis. Infect Immun. 2012;80(10):3343–3359. doi: 10.1128/IAI.00443-12. - DOI - PMC - PubMed
    1. Wilkinson RJ, Llewelyn M, Toossi Z, Patel P, Pasvol G, Lalvani A, Wright D, Latif M, Davidson RN. Influence of vitamin D deficiency and vitamin D receptor polymorphisms on tuberculosis among Gujarati Asians in west London: a case–control study. Lancet. 2000;355(9204):618–621. doi: 10.1016/S0140-6736(99)02301-6. - DOI - PubMed

Publication types

Substances