. 2013 Dec;89(6):1066-1080.
doi: 10.4269/ajtmh.13-0321. Epub 2013 Aug 19.

The complex relationship between weather and dengue virus transmission in Thailand

The complex relationship between weather and dengue virus transmission in Thailand

Karen M Campbell et al. Am J Trop Med Hyg. 2013 Dec.

Abstract

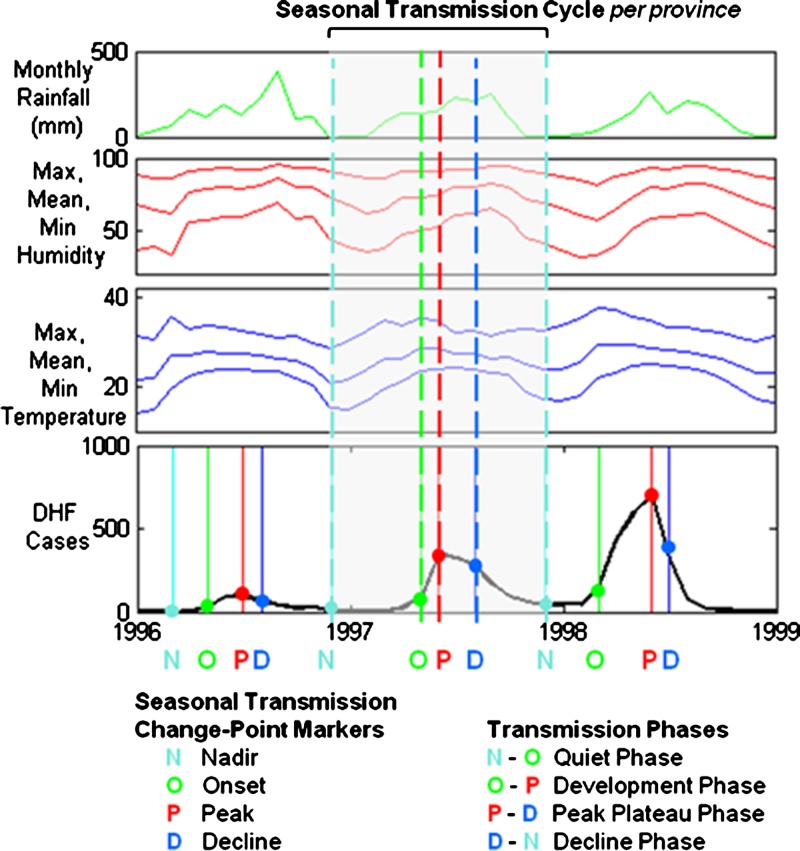
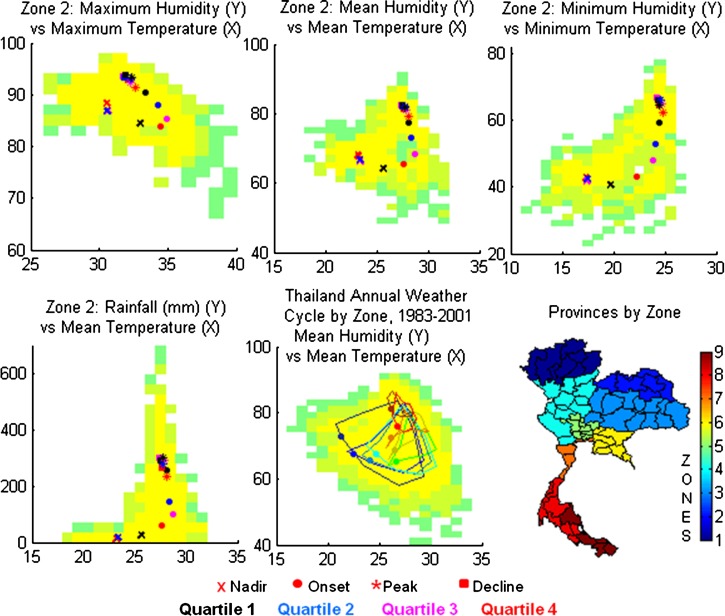
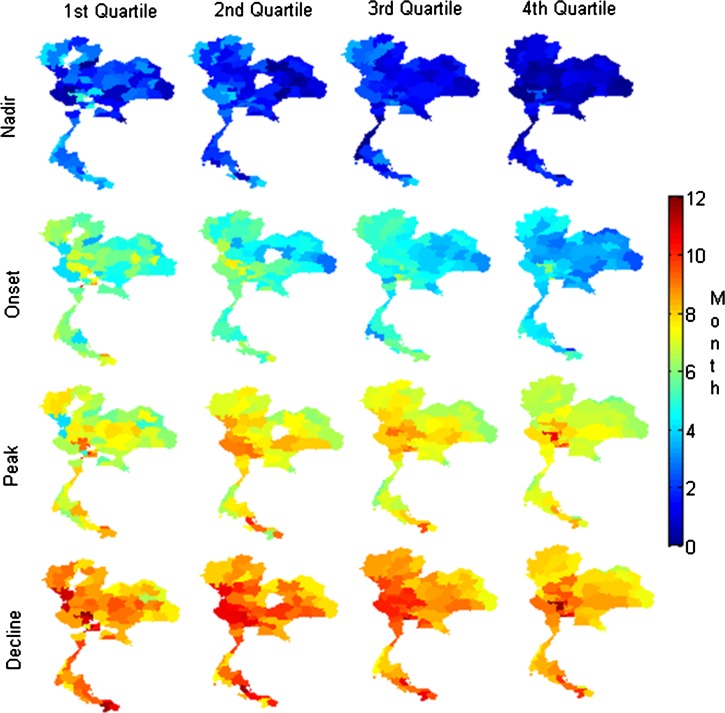
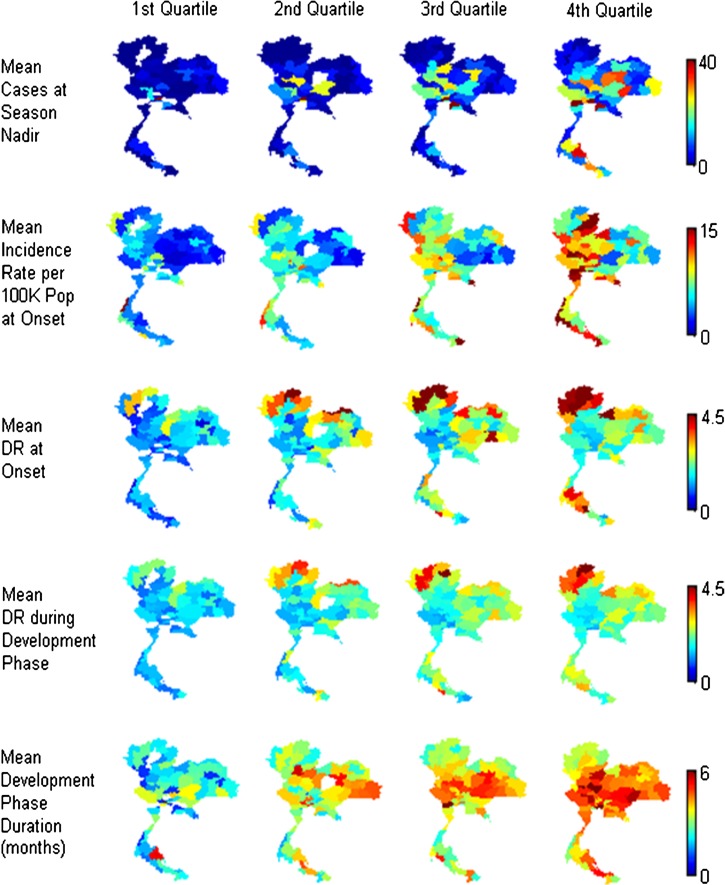
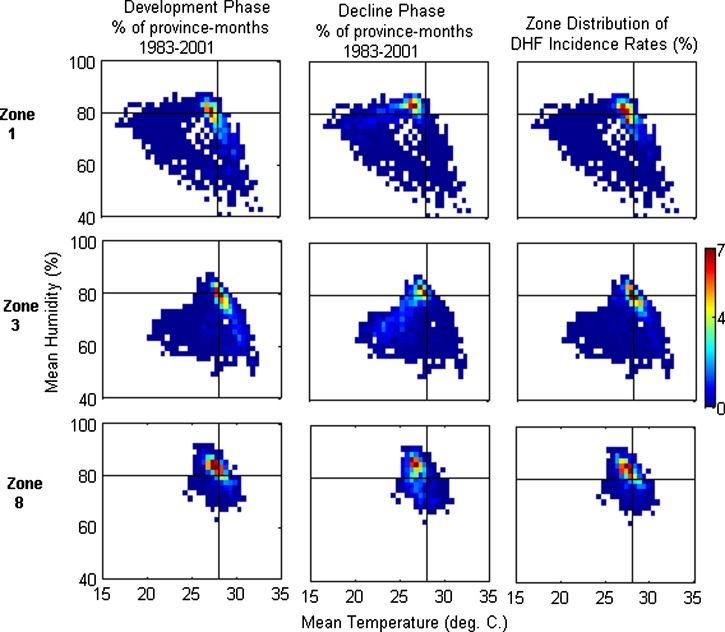
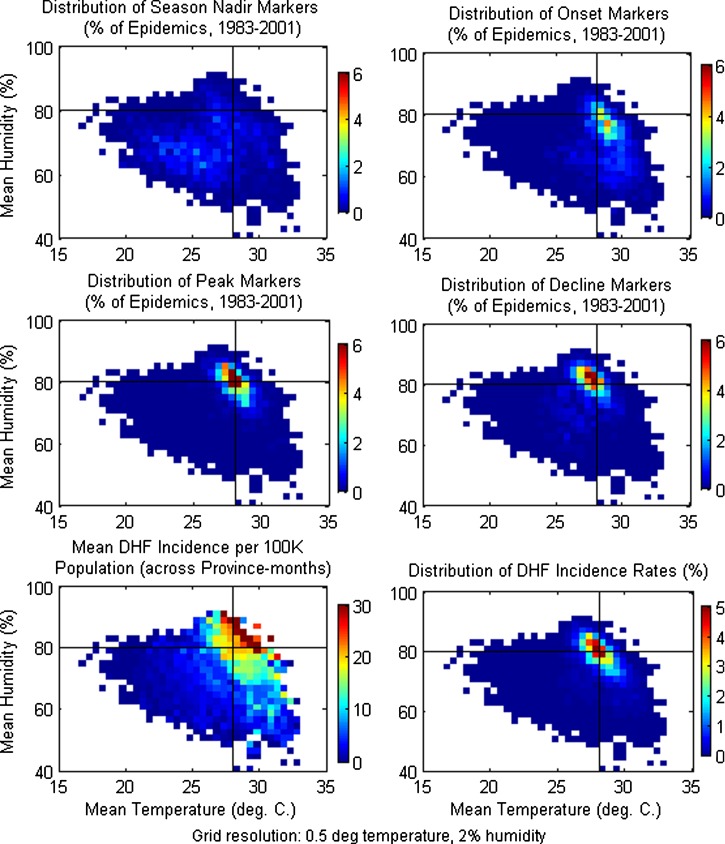
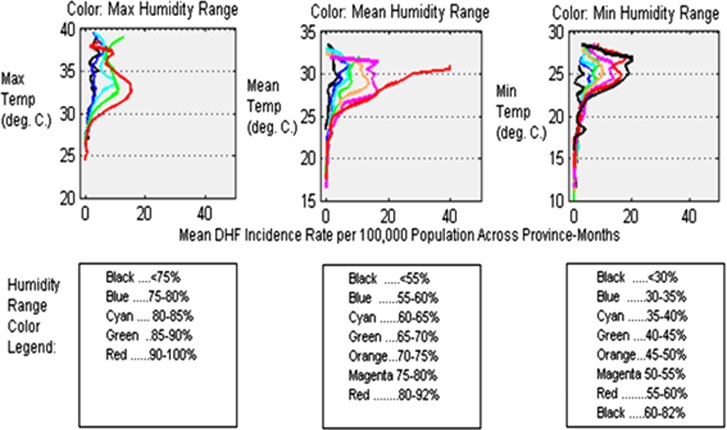
Using a novel analytical approach, weather dynamics and seasonal dengue virus transmission cycles were profiled for each Thailand province, 1983-2001, using monthly assessments of cases, temperature, humidity, and rainfall. We observed systematic differences in the structure of seasonal transmission cycles of different magnitude, the role of weather in regulating seasonal cycles, necessary versus optimal transmission "weather-space," basis of large epidemics, and predictive indicators that estimate risk. Larger epidemics begin earlier, develop faster, and are predicted at Onset change-point when case counts are low. Temperature defines a viable range for transmission; humidity amplifies the potential within that range. This duality is central to transmission. Eighty percent of 1.2 million severe dengue cases occurred when mean temperature was 27-29.5°C and mean humidity was > 75%. Interventions are most effective when applied early. Most cases occur near Peak, yet small reductions at Onset can substantially reduce epidemic magnitude. Monitoring the Quiet-Phase is fundamental in effectively targeting interventions pre-emptively.


Figures

Figure 1.
Figure 1.
Probability profile view for transmission of dengue virus. Diagram depicts multiple stochastic processes (associated with humans and mosquitoes), which interact to formulate an overall probability of a single human-vector-human transmission of dengue virus.
Figure 2.
Figure 2.
Geographic and temporal variation in dengue virus transmission and weather in Thailand. Patterns of weather (temperature, humidity, and rainfall) and monthly dengue hemorrhagic fever (DHF) incidence rates are shown for three Thai provinces, 1992–2000: blue, Udon Thani (northeast); green, Bangkok (south-central); and red, Trang (south).
Figure 3.
Figure 3.
Epidemic assessment tool applied to 1,368 seasonal transmission cycles in Thailand. The diagnostic tool defines four seasonal change points in the dynamics of transmission and thus four transmission phases in each seasonal dengue transmission cycle per province. This structure is used to examine the relationship between weather dynamics and dengue virus transmission dynamics at each transmission change point for seasonal cycles of varying incidence magnitude. The tool was applied to 72 provinces over 19 years, thus allowing examination of 1,368 seasonal transmission cycles.
Figure 4.
Figure 4.
Range of weather conditions and timing of change-points by incidence quartile in Thailand weather-space. In top row and bottom left panel, weather range for zone 2 is shown in yellow - light green - dark green background. Light green indicates weather conditions that occur in < 0.05% of province-months in zone 2 throughout the 19-year period. Dark green indicates weather occurring in < 0.01% of province-months for zone 2. Mean timing of zone 2 change-point markers per incidence quartile is shown in each weather space: Nadir, Onset; Peak, Decline. Incidence quartile associated with each marker is designated by color: red = Q4; magenta = Q3; blue = Q2; black = Q4. In bottom center panel, mean humidity versus mean temperature range is shown for all Thailand as a background for mean monthly weather trajectory shown for nine zones, beginning at the dot in January and moving in a counter-clockwise rotation. Light green indicates weather conditions occurring in < 0.1% of province months in Thailand throughout the 19-year period. Dark green indicates weather occurring in < 0.05% of province months. Bottom right panel indicates assignment of provinces to geographic zones based on correlated weather patterns. Grid interval is 1°C for temperature, 2% for humidity, 30 mm for rainfall.
Figure 5.
Figure 5.
Timing of the dengue virus seasonal transmission change-points. Mean month of occurrence of each change-point marker is color-coded by province for each epidemic class (dengue hemorrhagic fever [DHF] incidence quartile). Q1 represents smallest 25% of seasonal transmission cycles in Thailand, 1983–2001. Q4 represents largest 25%.
Figure 6.
Figure 6.
Seasonal dengue virus transmission development parameters. Mean observations of epidemic development parameters are color-coded by province for each epidemic class (dengue hemorrhagic fever [DHF] incidence quartile). Q1 represents smallest 25% of seasonal transmission cycles in Thailand, 1983–2001. Q4 represents largest 25%.
Figure 7.
Figure 7.
Distribution of dengue virus transmission seasonal change-points and dengue hemorrhagic fever (DHF) incidence rates by zone in Thailand. Change-points, Onset, and Peak, by incidence quartile are shown for each weather component in left column. Background indicates weather range for each zone. Within each panel, zones are layered 1–9 bottom to top. (See Figure 4 for spatial designation of zones.) Green background indicates weather occurring in < 1% of province months. Incidence quartile of change-points is designated by color of marker. In center column, DHF incidence rates occurring within the zone are distributed across the weather component range (colors indicate distribution of incidence rates per 100 K population per province-month as percent of sum over weather-space) for each of nine zones. In right column, the mean DHF incidence rate per 100 K population per province-month calculated from all province-months occurring in each weather interval is shown. Note from left column that more extreme weather intervals are rare events in each zone. More extreme weather intervals may be associated with a high incidence but occur rarely and contribute little to the percent of summed incidence rates shown in the center column. Grid interval is 1°C for temperature, 2% for humidity, 30 mm for rainfall.
Figure 8.
Figure 8.
Development and Decline Phase in mean humidity-temperature weather-space for three zones of Thailand. Frequency of occurrence of province-months in weather-space during Development Phase and Decline Phase is shown for three zones of contrasting weather patterns for 1983–2001. (Spatial designation of zones in shown in Figure 4; zone 1: northwest, zone 3: central eastern, zone 8: south.) Left column indicates distribution of occurrence of province-months during Development Phase for each of three zones. Center column indicates distribution of occurrence of province-months during Decline Phase. Right column indicates distribution of incidence rates per 100 K population per province-month (% of sum over all weather-space). Grid resolution is 0.5°C, 2% humidity. Reference lines are at 28°C mean temperature and 80% mean humidity. Minimum humidity-temperature and maximum humidity-temperature profiles are provided in the Supplemental Information Figures.
Figure 9.
Figure 9.
Distribution of seasonal transmission change-points in mean humidity-temperature weather-space in Thailand. Distribution of occurrence of change-point markers for all of Thailand in mean humidity versus mean temperature weather-space, 1983–2001: top left – Nadir, top right – Onset, center left – Peak, center right – Decline. Color indicates percent of total seasonal cycles. Mean dengue hemorrhagic fever (DHF) incidence rate per 100 K population per province-month for each grid interval across weather-space for all Thailand is shown in bottom left panel. Distribution of incidence rates per 100 K population per province-month (% of sum over all weather-space) is shown in bottom right panel. Reference lines are at 28°C mean temperature and 80% mean humidity. Minimum humidity-temperature and maximum humidity-temperature profiles are provided in the Supplemental Figures.
Figure 10.
Figure 10.
Distribution of 1983–2001 dengue hemorrhagic fever (DHF) incidence rates by seasonal transmission change-point and incidence quartile for all of Thailand. Distribution of DHF incidence rates (per 100 K population per province-month) by temperature and humidity weather components for each seasonal transmission change-point marker (N = Nadir, O = Onset, P = Peak, D = Decline) separated by incidence quartiles Q1–Q4 for all of Thailand. Grid resolution is 1°C temperature, 2% humidity.
Figure 11.
Figure 11.
Distribution of mean seasonal transmission Development Rate by incidence quartile. Distribution of mean Development Rate during Development Phase per seasonal transmission cycle for all of Thailand is shown in mean humidity-temperature weather-space, 1983–2001: top left – incidence Quartile 1, top right – incidence Quartile 2, bottom left – incidence Quartile 3, bottom right – incidence Quartile 4. Grid resolution is 0.5°C mean temperature, 2% mean humidity. Reference lines are at 28°C mean temperature and 80% mean humidity.
Figure 12.
Figure 12.
Combined effects of temperature and humidity on dengue hemorrhagic fever (DHF) incidence rates for all Thailand provinces, 1983–2001. The DHF incidence rate per 100 K population per province-month is averaged in 0.5°C temperature increments for different intervals of relative humidity (%) indicated by colors. Left: Maximum humidity and maximum temperature, center: mean humidity and mean temperature, right: minimum humidity and minimum temperature.

References

    1. Brady OJ, Gething PW, Bhatt S, Messina JP, Brownstein JS, Hoen AG, Moyes CL, Farlow AW, Scott TW, Hay SI. Refining the global spatial limits of dengue virus transmission by evidence-based consensus. PLoS Negl Trop Dis. 2012;6:e1760. - PMC - PubMed
    1. Bhatt S, Gething PW, Brady OJ, Messina JP, Farlow AW, Moyes CL, Drake JM, Brownstein JS, Hoen AG, Sankoh O, Myers MF, George DB, Jaenisch T, Wint GR, Simmons CP, Scott TW, Farrar JJ, Hay SI. The global distribution and burden of dengue. Nature. 2013;496:504–507. - PMC - PubMed
    1. Kroeger A, Nathan MB, Hombach J, Dayal-Drager R, Weber MW. Dengue research and training supported through the World Health Organization. Ann Trop Med Parasitol. 2006;100:S97–S101. - PubMed
    1. Schmitz J, Roehrig J, Barrett A, Hombach J. Next generation dengue vaccines: a review of candidates in preclinical development. Vaccine. 2011;29:7276–7284. - PubMed
    1. Halstead SB. Pathogenesis of dengue: challenges to molecular biology. Science. 1988;239:476–481. - PubMed

Publication types

MeSH terms