. 2013 Nov;8(11):1141-52.
doi: 10.4161/epi.26037. Epub 2013 Aug 19.

Considerations for normalization of DNA methylation data by Illumina 450K BeadChip assay in population studies

Affiliations

Considerations for normalization of DNA methylation data by Illumina 450K BeadChip assay in population studies

Paul Yousefi et al. Epigenetics. 2013 Nov.

Abstract

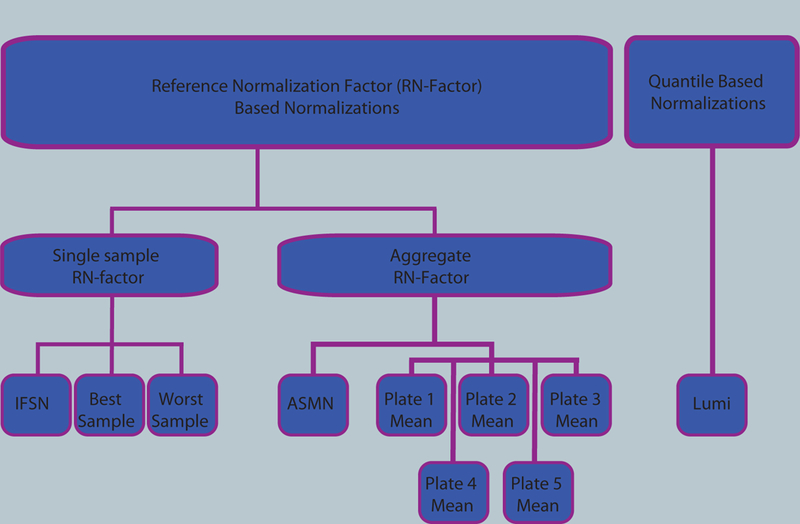
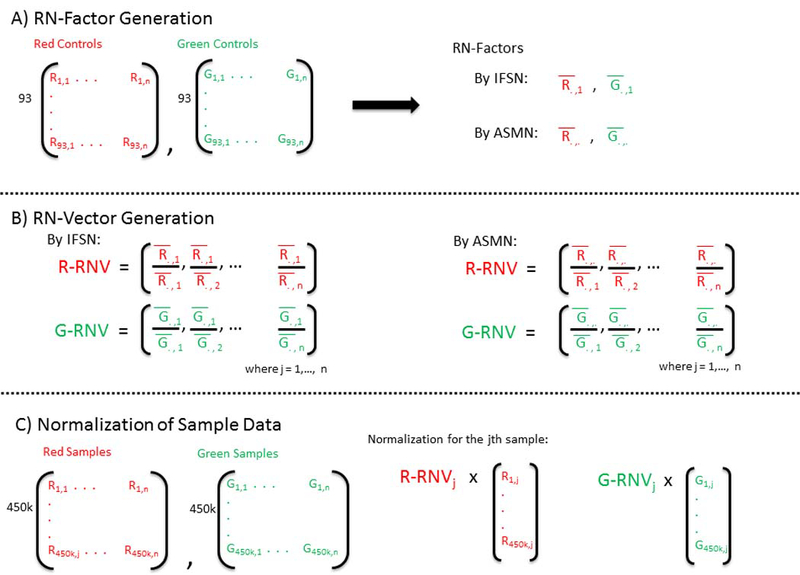
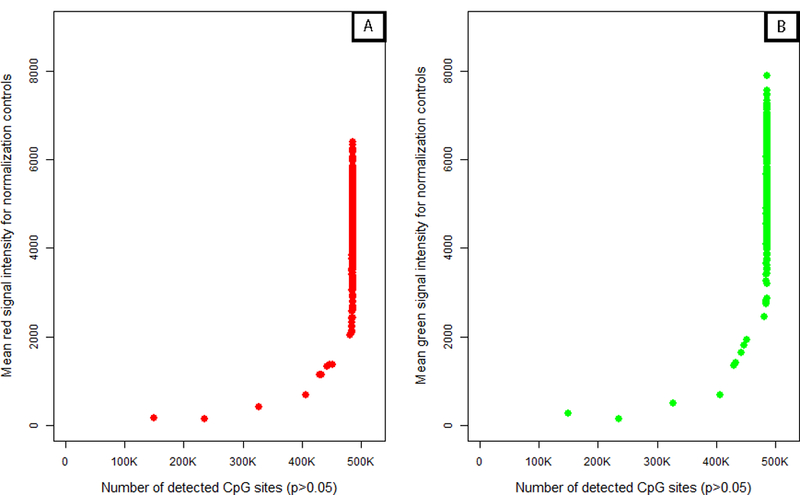
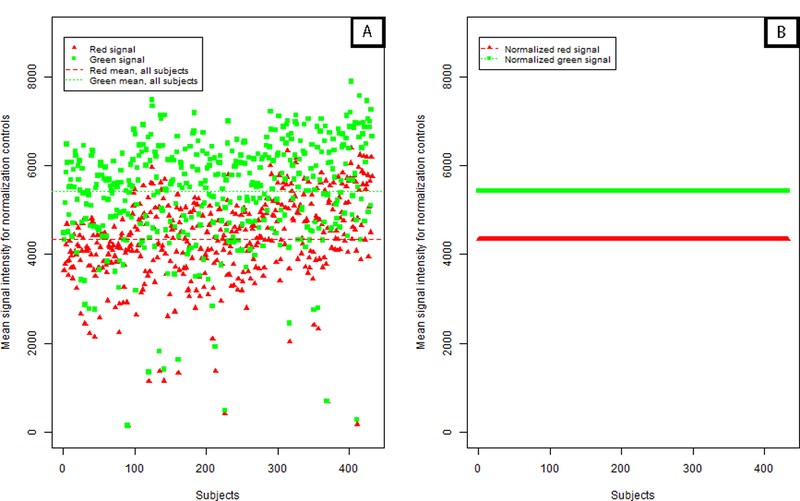
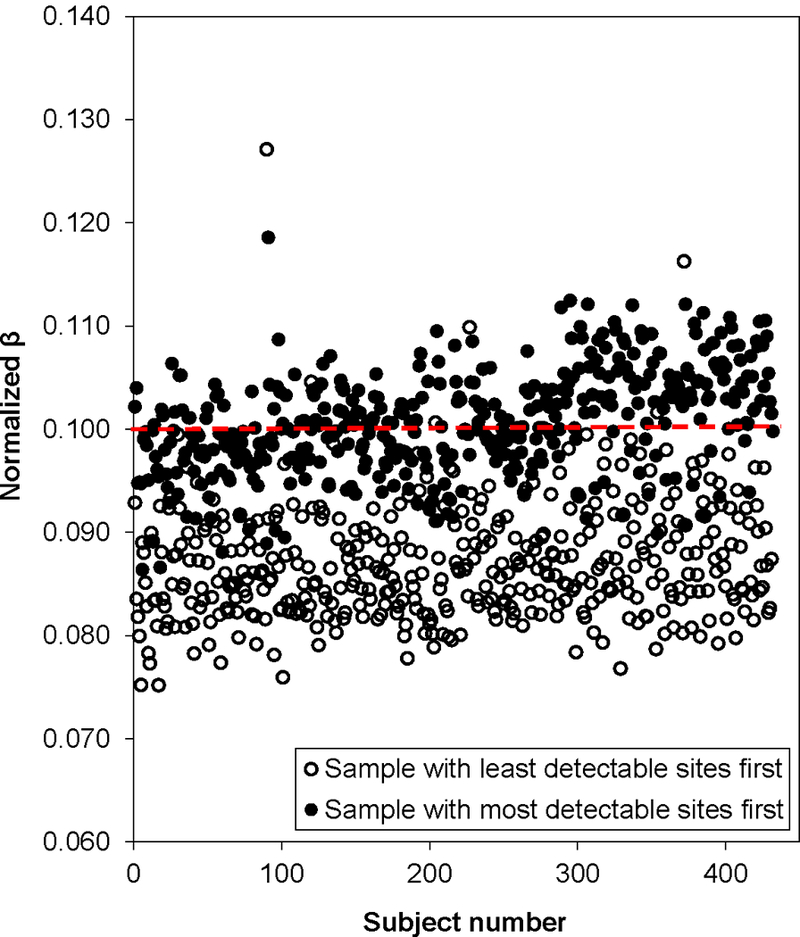
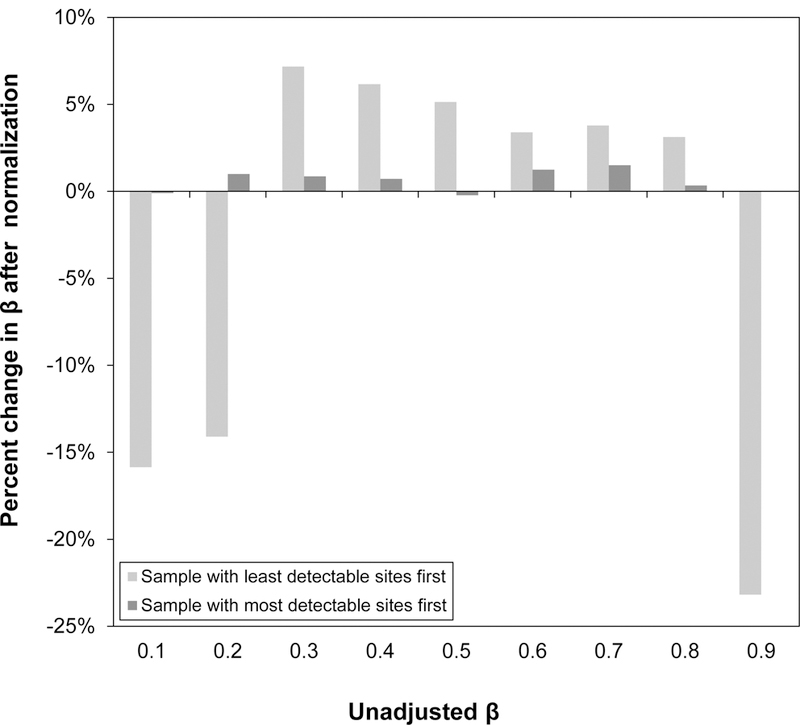
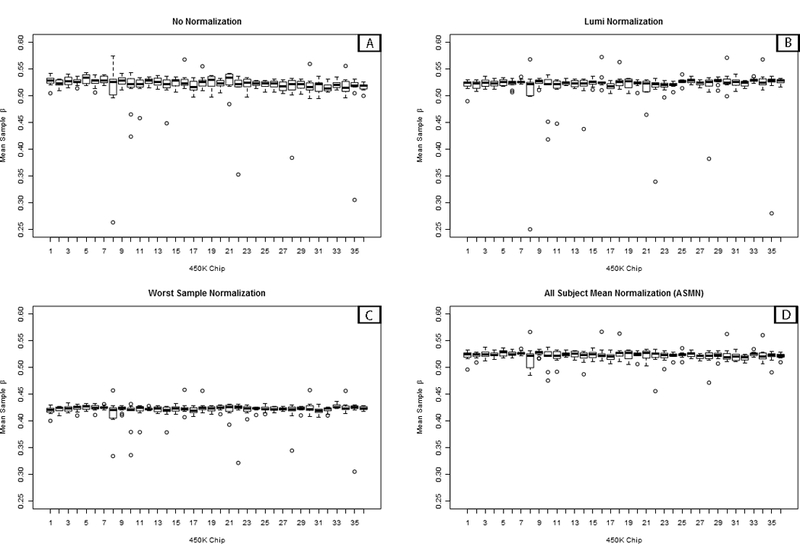
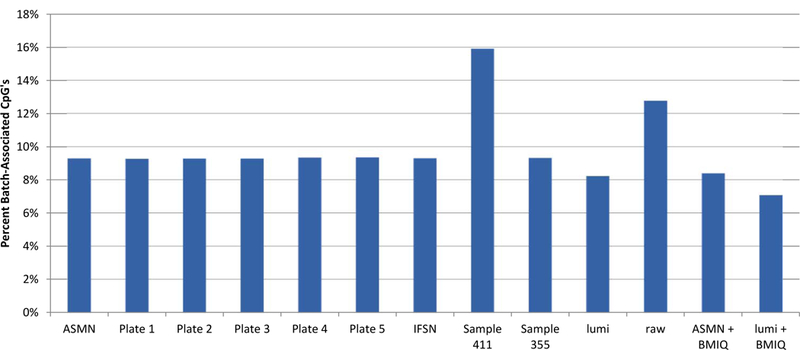
Analysis of epigenetic mechanisms, particularly DNA methylation, is of increasing interest for epidemiologic studies examining disease etiology and impacts of environmental exposures. The Infinium HumanMethylation450 BeadChip(®) (450K), which interrogates over 480,000 CpG sites and is relatively cost effective, has become a popular tool to characterize the DNA methylome. For large-scale studies, minimizing technical variability and potential bias is paramount. The goal of this paper was to evaluate the performance of several existing and novel color channel normalizations designed to reduce technical variability and batch effects in 450K analysis from a large population study. Comparative assessment of 10 normalization procedures included the GenomeStudio(®) Illumina procedure, the lumi smooth quantile approach, and the newly proposed All Sample Mean Normalization (ASMN). We also examined the performance of normalizations in combination with correction for the two types of Infinium chemistry utilized on the 450K array. We observed that the performance of the GenomeStudio(®) normalization procedure was highly variable and dependent on the quality of the first sample analyzed in an experiment, which is used as a reference in this procedure. While the lumi normalization was able to decrease batch variability, it increased variation among technical replicates, potentially reducing biologically meaningful findings. The proposed ASMN procedure performed consistently well, both at reducing batch effects and improving replicate comparability. In summary, the ASMN procedure can improve existing color channel normalization, especially for large epidemiologic studies, and can be successfully implemented to enhance a 450K DNA methylation data pipeline.

Keywords: ASMN; DNA methylome; bias correction; epigenetics; microarray; pipeline; technical variability.


Conflict of interest statement

The authors state that they have no potential conflicts of interest.

Figures

Figure 1.
Figure 1.. Flow chart of normalizations implemented.
Ten color channel normalization procedures were implemented. Nine of those procedures were reference normalization factor (RN-factor) based methods that use the n=93 normalization control probes assayed in every sample on the 450K chip for adjustment. Of the RN-factor based methods, three methods used the RN-factors from a single sample: the Illumina first sample normalization (IFSN), the best performing sample normalization, and the worst performing sample normalization. The remaining six RN-factor based procedures use aggregated RN-factors across different groups of samples, including the mean RN-factors for each plate of the experiment (Plates1–5 Means) and the all sample mean normalization (ASMN) that uses the mean RN-factors for all experimental samples. The remaining normalization, the lumi procedure, uses a quantile-based methodology instead of RN-factors.
Figure 2.
Figure 2.. Reference normalization factor (RN-factor) based color channel normalization for the 450K methylation array.
(A) The 450K chip includes n=93 normalization control probes in both assay colors (red and green). The mean values of these sites are used to create RN-factors for normalizing both color channels over all samples (i.e. an experiment). The Illumina first sample normalization (IFSN) method uses the first sample’s mean red and green control probes as RN-factors (R¯.,1 and G¯.,1). The all sample mean normalization (ASMN) method instead uses the mean read and green control probes taken across all control sites and all samples in a given experiment (R¯.,. and G¯.,.) as RN-factors. (B) A set of sample-wise normalization values, taken as the ratio of the RN-factor to each sample’s mean control probe values, is then computed. This results in a vector of length n normalization values for each color channel (R-RNV and G-RNV). (C) Color channel normalization of sample data occurs by multiplying the each of the jth sample’s red and green signals by the jth normalization value from the corresponding RN-vector (where j=1,2,…, n).
Figure 3.
Figure 3.. Plot of mean red (A) and green (B) signal intensity of normalization control probes (n=93) by number of detected CpG sites in the 450K array sample data (n=432).
For both color channels, samples with lower intensity readings in their normalization control probes tended to have more poor performing CpG sites in their samples.
Figure 4.
Figure 4.. Mean control probe color signal intensity before and after normalization.
(A) Distribution of mean green and red normalization controls (93 controls per signal color per sample) as included in the 450K chip over 432 DNA samples. Each point, red triangle or green square, represents the average of the normalization controls for that signal color per sample prior to implementation of color channel normalization. (B) Following adjustment using a reference normalization (RN) –factor based normalization, the average normalization controls for all samples are ‘forced’ to be the same level, making observations across samples comparable. Here, ASMN normalization was performed which uses the mean red and green signal for all samples for adjustment.
Figure 5.
Figure 5.. Plot of normalized DNA methylation (β’s) given an unadjusted β of 0.1 (Signal A=5000 and Signal B=570) for all 432 samples.
Open circles represent data normalized using the sample with the least detectable sites (sample 411, the lowest quality sample). Filled circles were normalized using the sample with the most detectable sites (sample 355, the highest quality sample).
Figure 6.
Figure 6.. Average percent change of methylation values, β’s, after normalization by best and worth performing samples.
Mean percent change in β’s, values ranging from 0.1 to 0.9, based on normalization by the lowest quality sample (largest amount of CpG sites with p<0.05) and the highest quality sample (least amount of CpG sites with p<0.05) over all samples (n=432). While normalization by the highest quality sample changed the β’s only slightly (<10% on average), normalization by the lowest quality sample tended to change the low and high methylation β’substantially (>10% on average).
Figure 7.
Figure 7.. Box plots of sample mean methylation by normalization methods.
Box plots of mean per-sample methylation (β) for all sites interrogated on the 450K array (n=485,512) by color channel normalization methods. Plots are shown for (A) un-normalized results and three different normalization methods, (B) lumi smooth quantile normalization, (C) normalization using the worst performing sample’s reference normalization factor values (sample 411), and (D) using the all sample mean normalization (ASMN) method. Each chip assays twelve samples, so every box plot contains twelve observations in total.
Figure 8.
Figure 8.. Percent of 450K array CpG sites associated with chip batch (p<0.01) shown by normalization method.
Normalization methods include: All sample mean normalization (ASMN), normalization by RN-factors taken as the mean control probe values for each of the plates (1–5) run, normalization by the worst performing sample’s reference normalization (RN) factor (sample 411) and the best performing sample’s RN-factor (sample 355), lumi smooth quantile normalization, and both the ASMN and lumi normalization followed by beta-mixture quantile normalization (BMIQ). Batch association was evaluated by ANOVA for each of the n=485,512 CpG sites interrogated.

Similar articles

Cited by

  • A pooling-based approach to mapping genetic variants associated with DNA methylation.
    Kaplow IM, MacIsaac JL, Mah SM, McEwen LM, Kobor MS, Fraser HB. Kaplow IM, et al. Genome Res. 2015 Jun;25(6):907-17. doi: 10.1101/gr.183749.114. Epub 2015 Apr 24. Genome Res. 2015. PMID: 25910490 Free PMC article.
  • Epigenetic Signatures of Salivary Gland Inflammation in Sjögren's Syndrome.
    Cole MB, Quach H, Quach D, Baker A, Taylor KE, Barcellos LF, Criswell LA. Cole MB, et al. Arthritis Rheumatol. 2016 Dec;68(12):2936-2944. doi: 10.1002/art.39792. Arthritis Rheumatol. 2016. PMID: 27332624 Free PMC article.
  • Cohort Profile: Pregnancy And Childhood Epigenetics (PACE) Consortium.
    Felix JF, Joubert BR, Baccarelli AA, Sharp GC, Almqvist C, Annesi-Maesano I, Arshad H, Baïz N, Bakermans-Kranenburg MJ, Bakulski KM, Binder EB, Bouchard L, Breton CV, Brunekreef B, Brunst KJ, Burchard EG, Bustamante M, Chatzi L, Cheng Munthe-Kaas M, Corpeleijn E, Czamara D, Dabelea D, Davey Smith G, De Boever P, Duijts L, Dwyer T, Eng C, Eskenazi B, Everson TM, Falahi F, Fallin MD, Farchi S, Fernandez MF, Gao L, Gaunt TR, Ghantous A, Gillman MW, Gonseth S, Grote V, Gruzieva O, Håberg SE, Herceg Z, Hivert MF, Holland N, Holloway JW, Hoyo C, Hu D, Huang RC, Huen K, Järvelin MR, Jima DD, Just AC, Karagas MR, Karlsson R, Karmaus W, Kechris KJ, Kere J, Kogevinas M, Koletzko B, Koppelman GH, Küpers LK, Ladd-Acosta C, Lahti J, Lambrechts N, Langie SAS, Lie RT, Liu AH, Magnus MC, Magnus P, Maguire RL, Marsit CJ, McArdle W, Melén E, Melton P, Murphy SK, Nawrot TS, Nisticò L, Nohr EA, Nordlund B, Nystad W, Oh SS, Oken E, Page CM, Perron P, Pershagen G, Pizzi C, Plusquin M, Raikkonen K, Reese SE, Reischl E, Richiardi L, Ring S, Roy RP, Rzehak P, Schoeters G, Schwartz DA, Sebert S, Snieder H, Sørensen TIA, Starling AP, Sunyer J, Taylor JA, Tiemeier H, Ullemar V, Vafeiadi M, Van Ijzendoorn MH,… See abstract for full author list ➔ Felix JF, et al. Int J Epidemiol. 2018 Feb 1;47(1):22-23u. doi: 10.1093/ije/dyx190. Int J Epidemiol. 2018. PMID: 29025028 Free PMC article. No abstract available.
  • Validation of biomarkers of aging.
    Moqri M, Herzog C, Poganik JR, Ying K, Justice JN, Belsky DW, Higgins-Chen AT, Chen BH, Cohen AA, Fuellen G, Hägg S, Marioni RE, Widschwendter M, Fortney K, Fedichev PO, Zhavoronkov A, Barzilai N, Lasky-Su J, Kiel DP, Kennedy BK, Cummings S, Slagboom PE, Verdin E, Maier AB, Sebastiano V, Snyder MP, Gladyshev VN, Horvath S, Ferrucci L. Moqri M, et al. Nat Med. 2024 Feb;30(2):360-372. doi: 10.1038/s41591-023-02784-9. Epub 2024 Feb 14. Nat Med. 2024. PMID: 38355974 Free PMC article. Review.
  • Rheumatoid Arthritis Naive T Cells Share Hypermethylation Sites With Synoviocytes.
    Rhead B, Holingue C, Cole M, Shao X, Quach HL, Quach D, Shah K, Sinclair E, Graf J, Link T, Harrison R, Rahmani E, Halperin E, Wang W, Firestein GS, Barcellos LF, Criswell LA. Rhead B, et al. Arthritis Rheumatol. 2017 Mar;69(3):550-559. doi: 10.1002/art.39952. Arthritis Rheumatol. 2017. PMID: 27723282 Free PMC article.

References

    1. Foley DL, Craig JM, Morley R, Olsson CJ, Dwyer T, Smith K, et al. Prospects for epigenetic epidemiology. Am J Epidemiol 2009; 169:389–400. - PMC - PubMed
    1. Pennisi E Behind the scenes of gene expression. Science 2001; 293:1064–7. - PubMed
    1. Ho SM, Tang WY. Techniques used in studies of epigenome dysregulation due to aberrant DNA methylation: an emphasis on fetal-based adult diseases. Reprod Toxicol 2007; 23:267–82. - PMC - PubMed
    1. Tammen SA, Friso S, Choi SW. Epigenetics: The link between nature and nurture. Mol Aspects Med 2012. - PMC - PubMed
    1. Laird PW. Principles and challenges of genomewide DNA methylation analysis. Nat Rev Genet 2010; 11:191–203. - PubMed

Publication types