

Road traffic injury mortality and its mechanisms in India: nationally representative mortality survey of 1.1 million homes
- PMID: 23959748
- PMCID: PMC3753525
- DOI: 10.1136/bmjopen-2013-002621
Road traffic injury mortality and its mechanisms in India: nationally representative mortality survey of 1.1 million homes
Abstract
Objectives: To quantify and describe the mechanism of road traffic injury (RTI) deaths in India.
Design: We conducted a nationally representative mortality survey where at least two physicians coded each non-medical field staff's verbal autopsy reports. RTI mechanism data were extracted from the narrative section of these reports.
Setting: 1.1 million homes in India.
Participants: Over 122 000 deaths at all ages from 2001 to 2003.
Primary and secondary outcome measures: Age-specific and sex-specific mortality rates, place and timing of death, modes of transportation and injuries sustained.
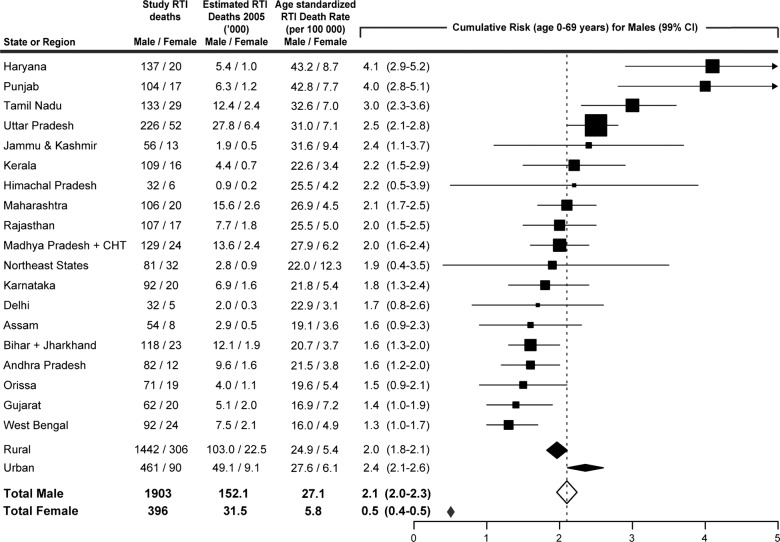
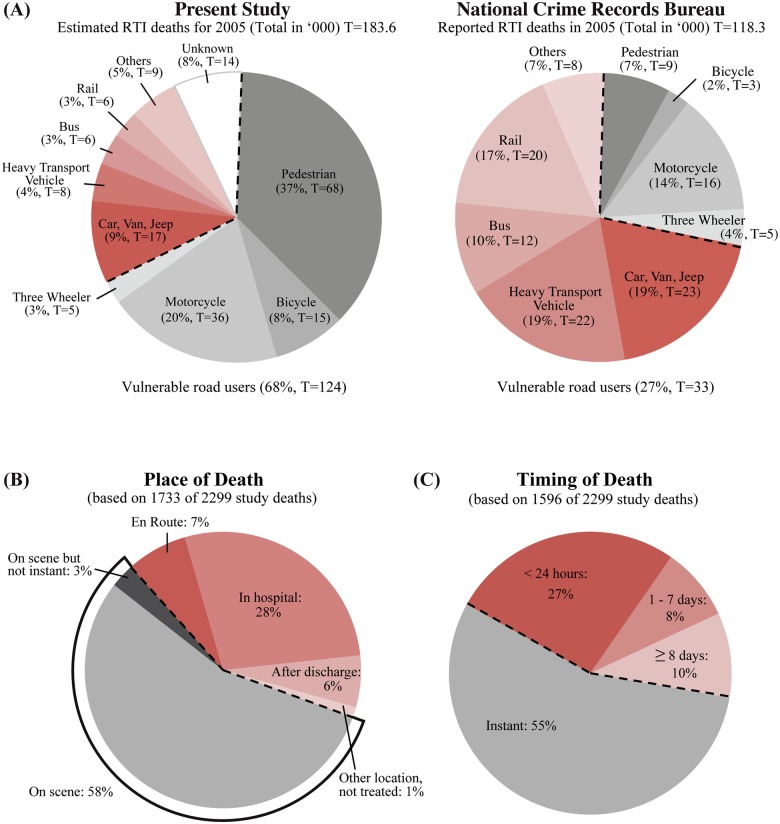
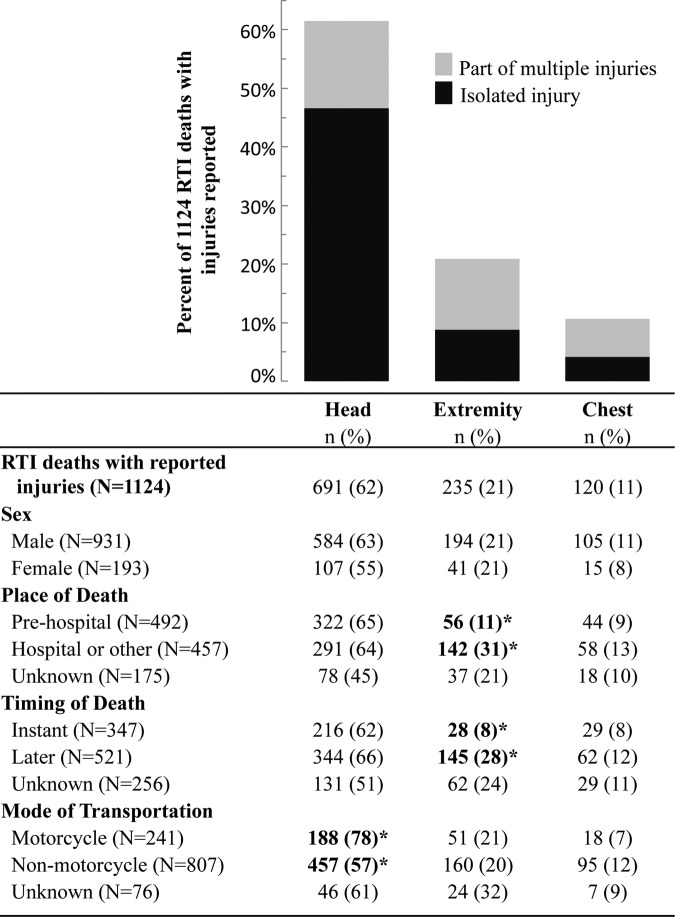
Results: The 2299 RTI deaths in the survey correspond to an estimated 183 600 RTI deaths or about 2% of all deaths in 2005 nationally, of which 65% occurred in men between the ages 15 and 59 years. The age-adjusted mortality rate was greater in men than in women, in urban than in rural areas, and was notably higher than that estimated from the national police records. Pedestrians (68 000), motorcyclists (36 000) and other vulnerable road users (20 000) constituted 68% of RTI deaths (124 000) nationally. Among the study sample, the majority of all RTI deaths occurred at the scene of collision (1005/1733, 58%), within minutes of collision (883/1596, 55%), and/or involved a head injury (691/1124, 62%). Compared to non-pedestrian RTI deaths, about 55 000 (81%) of pedestrian deaths were associated with less education and living in poorer neighbourhoods.
Conclusions: In India, RTIs cause a substantial number of deaths, particularly among pedestrians and other vulnerable road users. Interventions to prevent collisions and reduce injuries might address over half of the RTI deaths. Improved prehospital transport and hospital trauma care might address just over a third of the RTI deaths.
Keywords: India; low- and middle-income countries; road traffic injury; verbal autopsy.
Figures
References
-
- Peden M, Scurfield R, Sleet D, et al. World report on road traffic injury prevention: World Health Organization. 2004:1–244
-
- Barffour M, Gupta S, Gururaj G, et al. Evidence-based road safety practice in India: assessment of the adequacy of publicly available data in meeting requirements for comprehensive road safety data systems. Traffic Inj Prev 2012;13(Suppl 1):17–23 - PubMed
-
- Kopits E, Cropper ML. Traffic fatalities and economic growth. World Bank Development Research Group Environment and Infrastructure, 2003
Grants and funding
LinkOut - more resources
Full Text Sources
Other Literature Sources
Molecular Biology Databases