

Pathology imaging informatics for quantitative analysis of whole-slide images
- PMID: 23959844
- PMCID: PMC3822114
- DOI: 10.1136/amiajnl-2012-001540
Pathology imaging informatics for quantitative analysis of whole-slide images
Abstract
Objectives: With the objective of bringing clinical decision support systems to reality, this article reviews histopathological whole-slide imaging informatics methods, associated challenges, and future research opportunities.
Target audience: This review targets pathologists and informaticians who have a limited understanding of the key aspects of whole-slide image (WSI) analysis and/or a limited knowledge of state-of-the-art technologies and analysis methods.
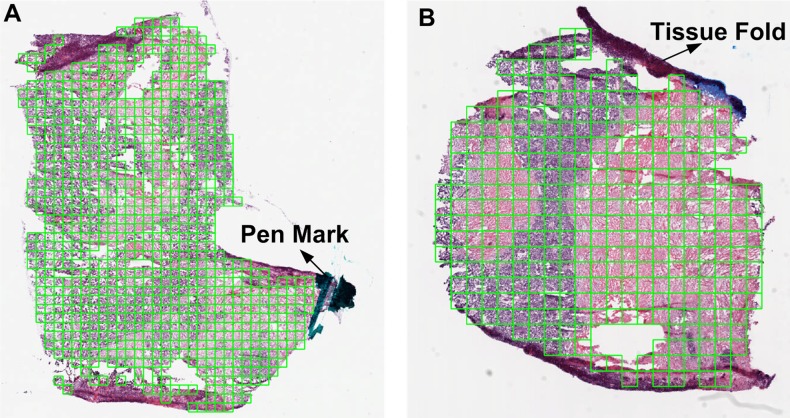
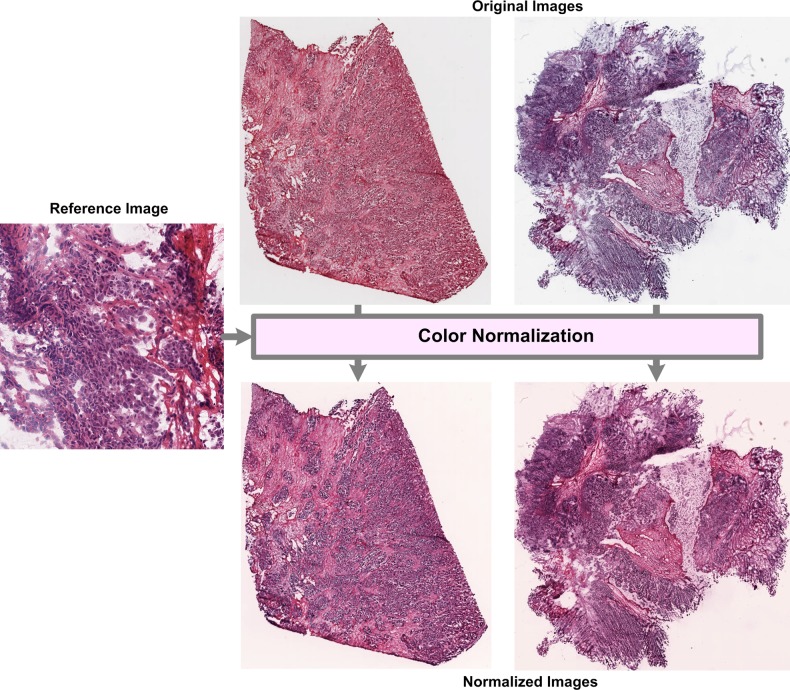
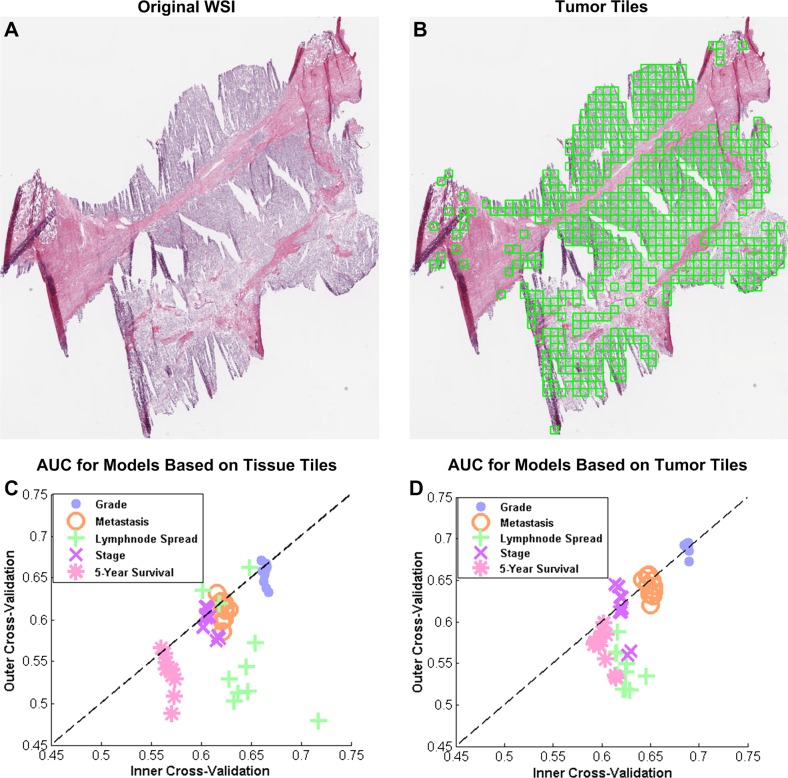
Scope: First, we discuss the importance of imaging informatics in pathology and highlight the challenges posed by histopathological WSI. Next, we provide a thorough review of current methods for: quality control of histopathological images; feature extraction that captures image properties at the pixel, object, and semantic levels; predictive modeling that utilizes image features for diagnostic or prognostic applications; and data and information visualization that explores WSI for de novo discovery. In addition, we highlight future research directions and discuss the impact of large public repositories of histopathological data, such as the Cancer Genome Atlas, on the field of pathology informatics. Following the review, we present a case study to illustrate a clinical decision support system that begins with quality control and ends with predictive modeling for several cancer endpoints. Currently, state-of-the-art software tools only provide limited image processing capabilities instead of complete data analysis for clinical decision-making. We aim to inspire researchers to conduct more research in pathology imaging informatics so that clinical decision support can become a reality.
Keywords: cancer prediction; computer-aided diagnosis; decision support systems; pathology imaging informatics; whole-slide images.
Figures


References
-
- Gabril MY, Yousef GM. Informatics for practicing anatomical pathologists: marking a new era in pathology practice. Mod Pathol 2010;23:349–58 - PubMed
-
- Wetzel A. Computational aspects of pathology image classification and retrieval. J Supercomput 1997;11:279–93
-
- Fuchs TJ, Buhmann JM. Computational pathology: challenges and promises for tissue analysis. Comput Med Imaging Graph 2011;35:515–30 - PubMed
-
- Amin W, Chandran U, Parwani Anil V, et al. Biomedical informatics for anatomic pathology. In: Cheng L, Bostwick DG, eds. Essentials of anatomic pathology. New York: Springer, 2011:469–80
Publication types
MeSH terms
Grants and funding
LinkOut - more resources
Full Text Sources
Other Literature Sources
