. 2013 Sep 3;110(36):14586-91.
doi: 10.1073/pnas.1221217110. Epub 2013 Aug 19.

Ontogeny of prosocial behavior across diverse societies

Affiliations

Ontogeny of prosocial behavior across diverse societies

Bailey R House et al. Proc Natl Acad Sci U S A. .

Abstract

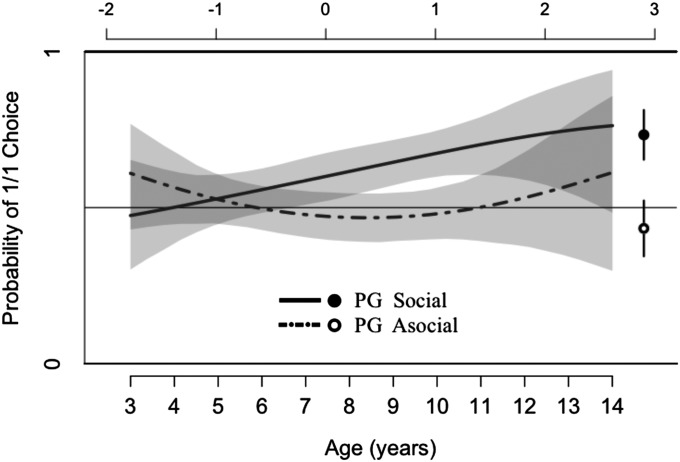
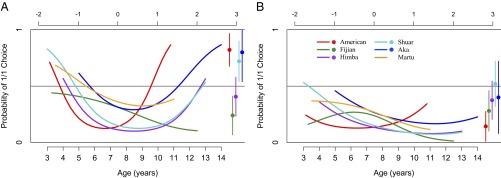
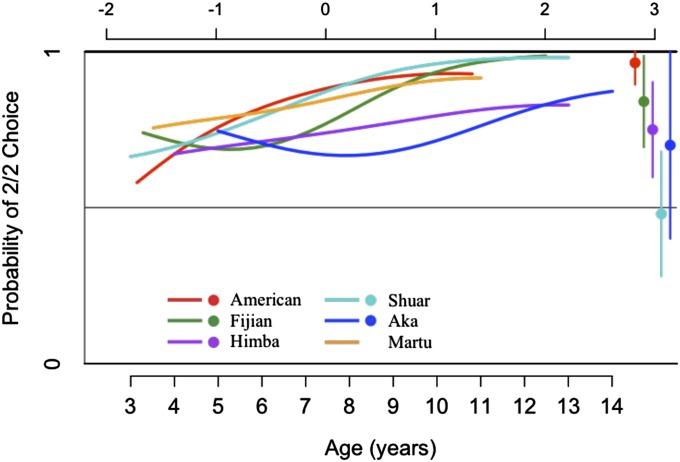
Humans are an exceptionally cooperative species, but there is substantial variation in the extent of cooperation across societies. Understanding the sources of this variability may provide insights about the forces that sustain cooperation. We examined the ontogeny of prosocial behavior by studying 326 children 3-14 y of age and 120 adults from six societies (age distributions varied across societies). These six societies span a wide range of extant human variation in culture, geography, and subsistence strategies, including foragers, herders, horticulturalists, and urban dwellers across the Americas, Oceania, and Africa. When delivering benefits to others was personally costly, rates of prosocial behavior dropped across all six societies as children approached middle childhood and then rates of prosociality diverged as children tracked toward the behavior of adults in their own societies. When prosocial acts did not require personal sacrifice, prosocial responses increased steadily as children matured with little variation in behavior across societies. Our results are consistent with theories emphasizing the importance of acquired cultural norms in shaping costly forms of cooperation and creating cross-cultural diversity.

Keywords: development; gene-culture coevolution; population differences.


Conflict of interest statement

The authors declare no conflict of interest.

Figures

Fig. 1.
Fig. 1.
Best-fit model of actors’ choices of 1/1 in the PG. Vertical axis is the estimated probability that children will choose the prosocial (1/1) outcome. Bottom horizontal axis is children’s age (in years), and top horizontal axis is the equivalent value of CA. Age functions capture the estimated probability that children will select the 1/1 outcome as a function of age, with estimates extracted from the best-fit model for the PG (Model B, Table 2) for both the social condition (solid line) and the asocial condition (dotted line). Wide CIs above age 13 are due to small samples above this age. The dot and hollow circle on the right side of the plot reflects the proportion of 1/1 choices actually made by adults in the PG social and PG asocial (respectively). The lines above and below the dot and circle correspond to 95% CIs. See SI Appendix, Appendix 4 for models and a comparable plot for the CSG.
Fig. 2.
Fig. 2.
Best-fit model of actors’ choices of 1/1 in the CSG. Vertical axis is the estimated probability that children will choose the prosocial (1/1) outcome. Bottom horizontal axis is children’s age (in years), and top horizontal axis is the equivalent value of CA. Colored lines represent estimates for child participants’ choices in each population. Dots on the right side of the plot represent data from adults’ actual choices in these populations, and lines above and below the dots correspond to 95% CIs. A plots choices in the CSG social, whereas B plots choices from the CSG asocial. Estimates are all extracted from the best-fit model for the CSG (Model D, Table 2). See SI Appendix, Appendix 4 for models and SI Appendix, Appendix 6 for CIs.
Fig. 3.
Fig. 3.
Best-fit model of actors’ choices of 2/2 in FAM1 social. Vertical axis is the estimated probability that children will choose the income-maximizing (2/2) outcome. Bottom horizontal axis is children’s age (in years), and top horizontal axis is the equivalent value of CA. Colored lines represent the age functions for child participants’ choices in each population. Dots on the right side of the plot represent data from adults’ actual choices in these populations, and lines above and below the dots correspond to 95% CIs. Estimates for each population were extracted from the best-fit model for FAM1 social (Model C, Table 2). See SI Appendix, Appendix 4 for models, and SI Appendix, Appendix 7 for CIs.

References

    1. Axelrod R, Hamilton WD. The evolution of cooperation. Science. 1981;211(4489):1390–1396. - PubMed
    1. Silk JB, House BR. Evolutionary foundations of human prosocial sentiments. Proc Natl Acad Sci USA. 2011;108(Suppl 2):10910–10917. - PMC - PubMed
    1. Chudek M, Henrich J. Culture-gene coevolution, norm-psychology and the emergence of human prosociality. Trends Cogn Sci. 2011;15(5):218–226. - PubMed
    1. Richerson PJ, Boyd R. Not by Genes Alone: How Culture Transformed Human Evolution. Chicago: Univ of Chicago Press; 2005.
    1. Henrich J, et al. “Economic man” in cross-cultural perspective: Behavioral experiments in 15 small-scale societies. Behav Brain Sci. 2005;28(6):795–815, discussion 815–855. - PubMed

Publication types