. 2013 Sep 3;110(36):14771-6.
doi: 10.1073/pnas.1302212110. Epub 2013 Aug 19.

Low levels of copper disrupt brain amyloid-β homeostasis by altering its production and clearance

Affiliations

Low levels of copper disrupt brain amyloid-β homeostasis by altering its production and clearance

Itender Singh et al. Proc Natl Acad Sci U S A. .

Abstract

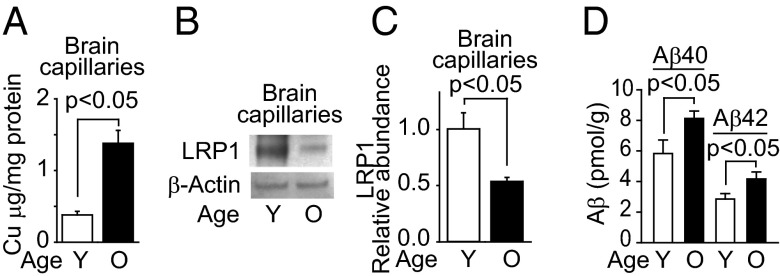
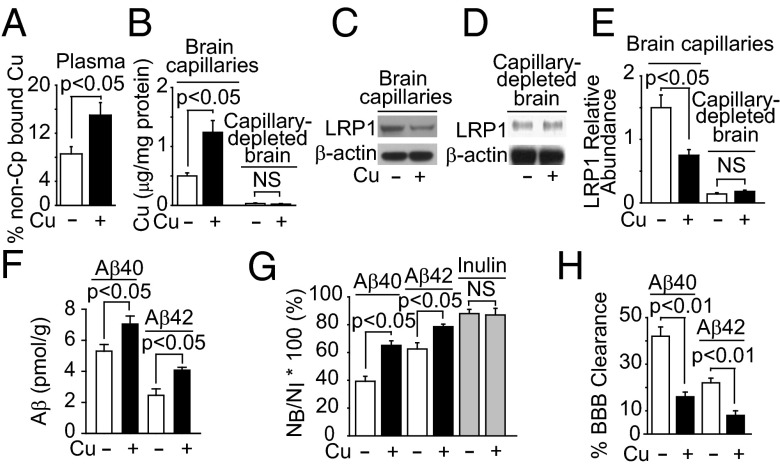
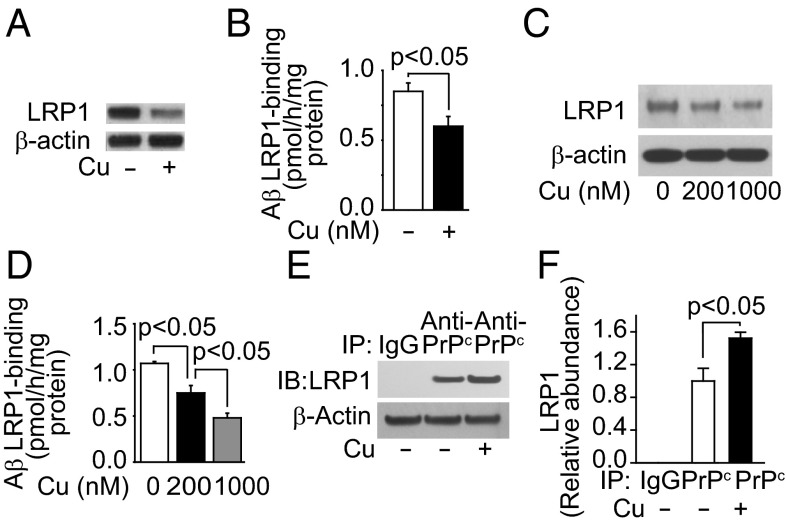
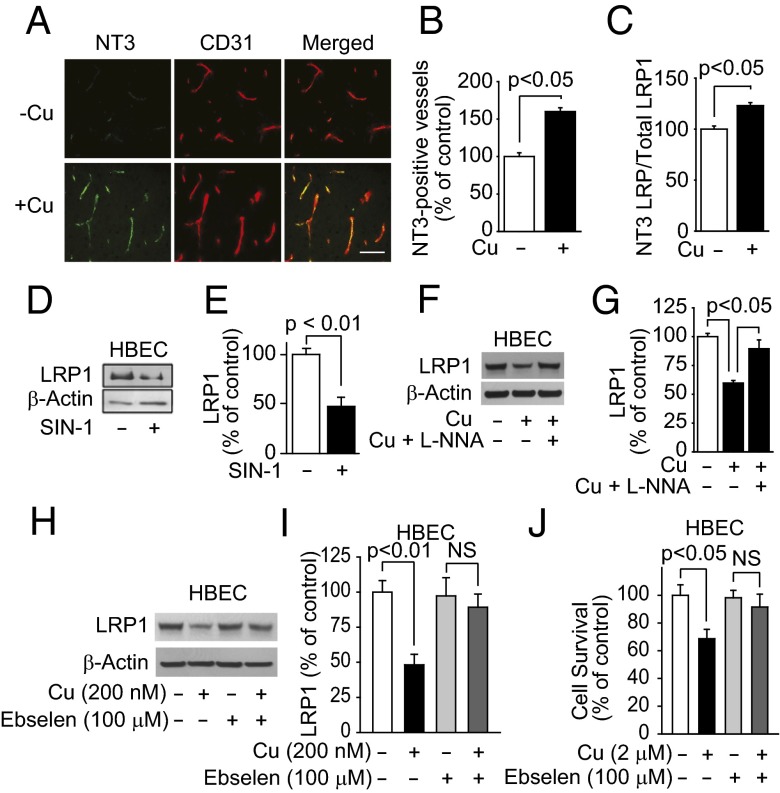
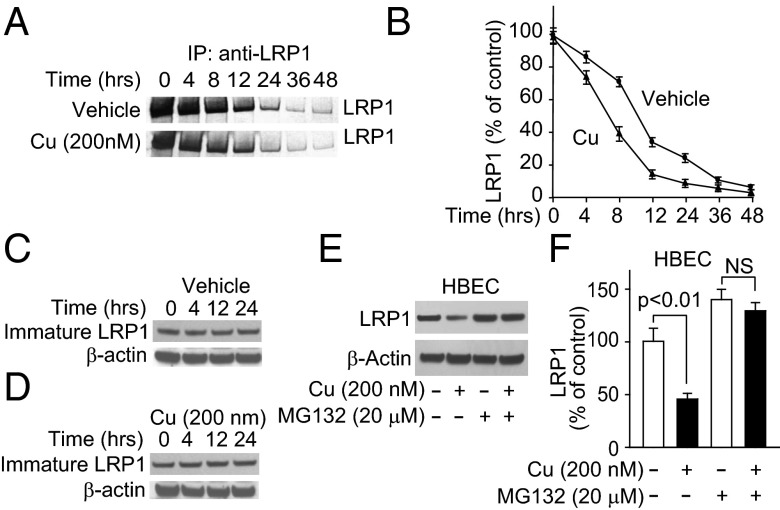
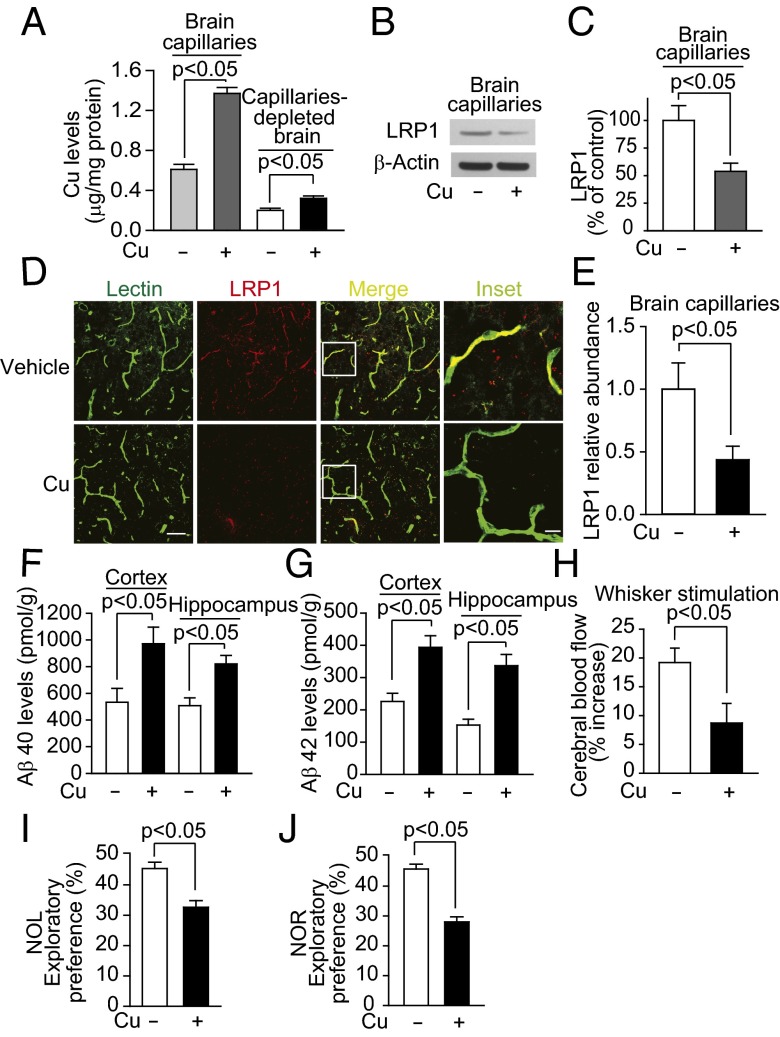
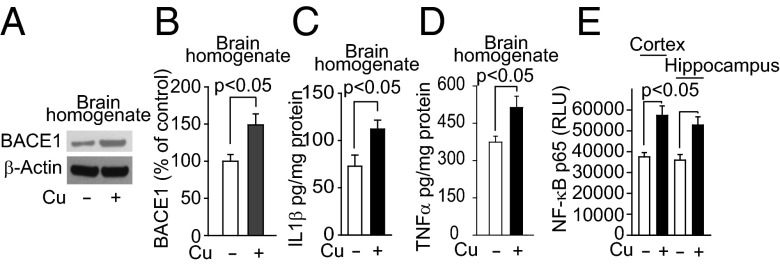
Whereas amyloid-β (Aβ) accumulates in the brain of normal animals dosed with low levels of copper (Cu), the mechanism is not completely known. Cu could contribute to Aβ accumulation by altering its clearance and/or its production. Because Cu homeostasis is altered in transgenic mice overexpressing Aβ precursor protein (APP), the objective of this study was to elucidate the mechanism of Cu-induced Aβ accumulation in brains of normal mice and then to explore Cu's effects in a mouse model of Alzheimer's disease. In aging mice, accumulation of Cu in brain capillaries was associated with its reduction in low-density lipoprotein receptor-related protein 1 (LRP1), an Aβ transporter, and higher brain Aβ levels. These effects were reproduced by chronic dosing with low levels of Cu via drinking water without changes in Aβ synthesis or degradation. In human brain endothelial cells, Cu, at its normal labile levels, caused LRP1-specific down-regulation by inducing its nitrotyrosination and subsequent proteosomal-dependent degradation due in part to Cu/cellular prion protein/LRP1 interaction. In APP(sw/0) mice, Cu not only down-regulated LRP1 in brain capillaries but also increased Aβ production and neuroinflammation because Cu accumulated in brain capillaries and, unlike in control mice, in the parenchyma. Thus, we have demonstrated that Cu's effect on brain Aβ homeostasis depends on whether it is accumulated in the capillaries or in the parenchyma. These findings should provide unique insights into preventative and/or therapeutic approaches to control neurotoxic Aβ levels in the aging brain.

Keywords: BACE1; BBB; cerebrovascular; environmental; toxicity.


Conflict of interest statement

The authors declare no conflict of interest.

Figures

Fig. 1.
Fig. 1.
Aging increased Cu levels in brain capillaries and Aβ levels in mice brains. Levels of Cu (A), representative Western blot analysis of LRP1 (B), and quantification of relative LRP1 levels from data as in B (C) in isolated brain microvessels from 2- to 3-mo-old (Y) and 25- to 28-mo-old mice (O). (D) Mouse endogenous Aβ40 and Aβ42 levels in the cerebrum: 2- to 3-mo-old mice (clear column) and 25- to 28-mo-old mice (black column). β-Actin was the reference molecule for each Western blot analysis. Values are mean ± SEM, n = 5 mice per group.
Fig. 2.
Fig. 2.
Cu reduced LRP1-mediated 125I-Aβ clearance across the BBB. (A) Nonceruloplasmin (Cp) bound Cu levels in plasma. (B) Cu levels in brain capillaries and capillary depleted brain. (C and D) Representative LRP1 Western blot analysis for isolated brain capillaries and capillary-depleted brain and their relative quantification (E), (F) Mouse cerebrum endogenous Aβ40 and Aβ42 levels, (G) Brain recovery of human 125I-Aβ40, 125I-Aβ42 and 14C-inulin (gray column) 30 min after their simultaneous injection into the caudate nucleus, and (H) BBB 125I-Aβ clearance from data in G. Mice were treated with low levels of Cu (+) or vehicle (−) in their drinking water for 90 d starting at 2 mo of age. β-Actin was the reference molecule for each Western blot analysis. Values are mean ± SEM, n = 5 mice per group.
Fig. 3.
Fig. 3.
Cu down-regulated LRP1 and reduced Aβ binding in brain endothelial cells. (A) Representative Western blot analysis of LRP1. (B) The 125I-Aβ42 binding in primary mouse endothelial cells treated with (+, 200 nM) and without Cu (−). (C) Representative LRP1 Western blot analysis. (D) The 125I-Aβ42 binding with (200 nM, black column; 1 μM, gray column) and without Cu (clear column) in human brain endothelial cells (HBECs). (E) Representative LRP1 immunoblotting after immunoprecipitation with IgG or antiprion antibody in the presence (200 nM) and absence of Cu. (F) Relative levels of LRP1 from data as in E. β-Actin was the reference molecule for each Western blot analysis. Values are mean ± SEM, n = 3–5 independent experiments per group.
Fig. 4.
Fig. 4.
Cu increased LRP1 nitrotyrosination. (A) Representative immunostained brain sections for nitrotyrosine (NT3), CD31 (endothelial marker), and merged images in mice treated with tracer levels of Cu or vehicle in their drinking water. (Scale bar, 50 μm.) (B) Quantification of nitrotyrosine-positive vessels in A. (C) NT3-LRP1/ total LRP1 ratio in HBECs treated with (200 nM) and without Cu. (D) Representative LRP1 Western blot analysis and its quantification (E) in HBECs treated with and without nitric oxide donor (sodium nitroprusside; 1 μM). (F) Representative LRP1 Western blot analysis and its quantification (G) in HBECs treated with vehicle, Cu (200 nM), and with Cu (200 nM) and 10−4 M l-NNA (nitro-l-arginine). (H) Representative LRP1 Western blot analysis and its quantification (I) in HBECs treated with and without Cu or with ebselen, a decomposition catalyst of peroxynitrite. (J) HBEC survival with and without Cu or ebselen. β-Actin was the reference molecule for each Western blot analysis. Values are mean ± SEM, n = 4–5 independent experiment or mice per group.
Fig. 5.
Fig. 5.
Cu increased LRP1 proteosomal-dependent degradation in HBECs. (A) Representative autoradiogram of [35S]methionine-labeled LRP1 in HBECs after 1-h pulse with [35S]methionine and chased for the indicated time. (B) Quantification of LRP1 levels from the data in A. (C and D) Immature 600 kDa LRP1 (LRP-600) with and without Cu at the indicated chase times. (E and F) Representative immunoblots and quantification of LRP1 in the presence and absence of Cu and with Cu and MG132. Values are mean ± SEM, n = 5 independent experiments per group.
Fig. 6.
Fig. 6.
Cu reduced LRP1levels in brain capillaries and increased brain Aβ levels in APPsw/o mice. (A) Cu levels in brain capillaries and capillary-depleted brain. (B) Representative LRP1 Western blot analysis for isolated brain capillaries and its quantification (C). (D) Representative immunostained images of brain section for lectin, LRP1, and merged images. (Scale bar, 50 µm.) and relative quantification of LRP1-positive vessels (E). (F and G) Aβ40 and Aβ42 levels. (H) Cerebral blood flow responses to brain stimulation: (I) NOL and (J) NOR responses. APPsw/0 mice were treated with tracer levels of Cu (+) or vehicle (−) in their drinking water for 90 d starting at 6 mo old. β-Actin was the reference molecule for each Western blot analysis. Values are mean ± SEM, n = 8 mice per group.
Fig. 7.
Fig. 7.
Cu increased levels of BACE1 and proinflammatory cytokines in APPsw/o mice. (A) Representative BACE1 Western blot analysis in brain homogenates and its quantification (B). (C) Levels of IL1β and TNFα (D), and NF-κB p65 nuclear levels (E) in the cortex and hippocampus. APPsw/0 mice were treated with tracer levels of Cu (+) or vehicle (−) in their drinking water for 90 d starting at 6 mo old. β-Actin was the reference molecule for each Western blot analysis. Values are mean ± SEM, n = 4 mice per group.

References

    1. Prohaska JR. Role of copper transporters in copper homeostasis. Am J Clin Nutr. 2008;88(3):826S–829S. - PMC - PubMed
    1. Lutsenko S, Bhattacharjee A, Hubbard AL (2010) Copper handling machinery of the brain. Metallomics 2(9):596–608. - PubMed
    1. Chutkow JG (1978) Evidence for uptake of nonceruloplasminic copper in the brain: Effect of ionic copper and amino acids. Proc Soc Exp Biol Med. 158(1):113–116. - PubMed
    1. Harris ED. Cellular copper transport and metabolism. Annu Rev Nutr. 2000;20:291–310. - PubMed
    1. Brewer GJ. Copper excess, zinc deficiency, and cognition loss in Alzheimer’s disease. Biofactors. 2012;38(2):107–113. - PubMed

Publication types

MeSH terms

Substances