

Design and characterization of synthetic fungal-bacterial consortia for direct production of isobutanol from cellulosic biomass
- PMID: 23959872
- PMCID: PMC3767521
- DOI: 10.1073/pnas.1218447110
Design and characterization of synthetic fungal-bacterial consortia for direct production of isobutanol from cellulosic biomass
Abstract
Synergistic microbial communities are ubiquitous in nature and exhibit appealing features, such as sophisticated metabolic capabilities and robustness. This has inspired fast-growing interest in engineering synthetic microbial consortia for biotechnology development. However, there are relatively few reports of their use in real-world applications, and achieving population stability and regulation has proven to be challenging. In this work, we bridge ecology theory with engineering principles to develop robust synthetic fungal-bacterial consortia for efficient biosynthesis of valuable products from lignocellulosic feedstocks. The required biological functions are divided between two specialists: the fungus Trichoderma reesei, which secretes cellulase enzymes to hydrolyze lignocellulosic biomass into soluble saccharides, and the bacterium Escherichia coli, which metabolizes soluble saccharides into desired products. We developed and experimentally validated a comprehensive mathematical model for T. reesei/E. coli consortia, providing insights on key determinants of the system's performance. To illustrate the bioprocessing potential of this consortium, we demonstrate direct conversion of microcrystalline cellulose and pretreated corn stover to isobutanol. Without costly nutrient supplementation, we achieved titers up to 1.88 g/L and yields up to 62% of theoretical maximum. In addition, we show that cooperator-cheater dynamics within T. reesei/E. coli consortia lead to stable population equilibria and provide a mechanism for tuning composition. Although we offer isobutanol production as a proof-of-concept application, our modular system could be readily adapted for production of many other valuable biochemicals.
Keywords: consolidated bioprocessing; lignocellulosic biofuel; renewable energy.
Conflict of interest statement
The authors declare no conflict of interest.
Figures

 , fraction of substrate carbon consumed by E. coli (grams per total grams); QI, isobutanol productivity (grams per gram of cellulose per hour); Rcel, mean cellulose hydrolysis rate (grams per liter per hour); REc, mean E. coli growth rate (grams per liter per hour); RTr, mean T. reesei growth rate (grams per liter per hour); XEc, E. coli population fraction at fermentation end point (grams per gram of total microbial biomass); and
  , isobutanol yield (grams per gram of cellulose). The most significant PRCCs (
 and
and  ) are shown here; full results are provided in
  over all sets of parameter and IC values sampled in sensitivity analysis. Individual points are shown in low-density (<1.25) regions. Axes are padded by 4% at each end to ensure visibility of all data. (D) Theoretical analysis of isobutanol production. Parameter values and ICs correspond to the point denoted by the white asterisk in C, with Fa, fraction of substrate bonds accessible to enzymes, modified to 0.011. Numerical solutions were calculated over a range of initial E. coli fraction,
  , values. Key fermentation metrics are shown (Rcel,
  , and QI); the green dashed line denotes the theoretical maximum of
  (0.41 g/g). More details are provided in
 on 10 g/L MCC. (C) RUTC30/NV3 biculture
  on 20 g/L MCC. E. coli data points are color-coded to indicate population fraction retaining plasmids pSA55/69 (error bars are shown in
  , where
  is the percentage change in output Z and
  is the percentage change in parameter X. Response coefficients for
  and Rcel are shown for top 10 parameters (ranked by
  ), with the color code indicating the direction of the parameter/IC perturbation for the plotted response.
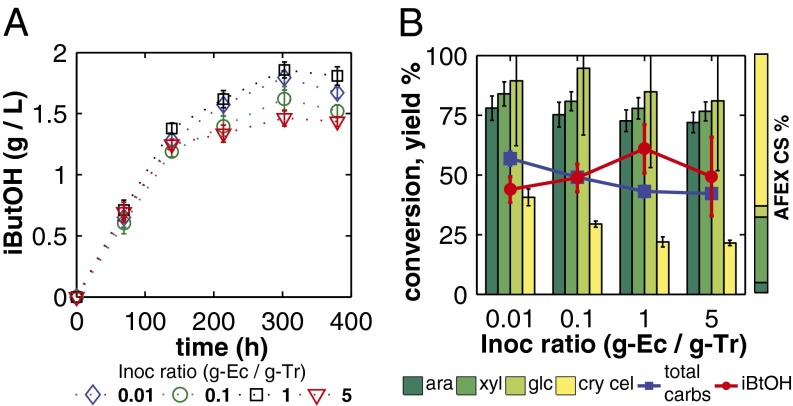
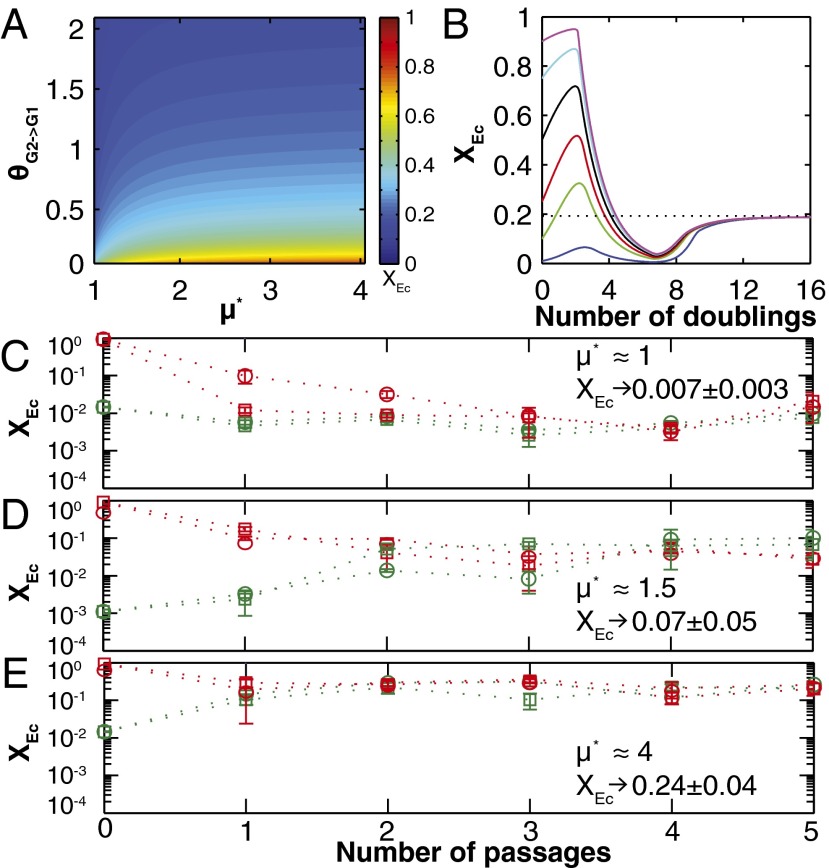
 were calculated over a range of plausible values for
  and
and  . (B) Sample numerical solutions for
  and
and  over a range of
  . (C) Experimentally observed dynamics for RUTC30/K12 bicultures at pH 5.3
  . Cultures were inoculated with high or low
  (red or green points/lines, respectively) in duplicate (circles/squares). Data are shown for each culture, and error bars are ±SD for n = 2 technical replicates. (D) RUTC30/NV3 bicultures at pH 6.0
  . (E) RUTC30/K12 bicultures at pH 6.0
  .
.References
Publication types
MeSH terms
Substances
Grants and funding
LinkOut - more resources
Full Text Sources
Other Literature Sources
Medical
