Segmenting the human genome based on states of neutral genetic divergence
- PMID: 23959903
- PMCID: PMC3767554
- DOI: 10.1073/pnas.1221792110
Segmenting the human genome based on states of neutral genetic divergence
Abstract
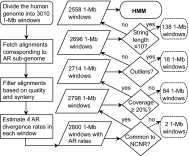
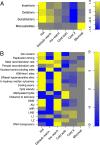
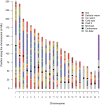
Many studies have demonstrated that divergence levels generated by different mutation types vary and covary across the human genome. To improve our still-incomplete understanding of the mechanistic basis of this phenomenon, we analyze several mutation types simultaneously, anchoring their variation to specific regions of the genome. Using hidden Markov models on insertion, deletion, nucleotide substitution, and microsatellite divergence estimates inferred from human-orangutan alignments of neutrally evolving genomic sequences, we segment the human genome into regions corresponding to different divergence states--each uniquely characterized by specific combinations of divergence levels. We then parsed the mutagenic contributions of various biochemical processes associating divergence states with a broad range of genomic landscape features. We find that high divergence states inhabit guanine- and cytosine (GC)-rich, highly recombining subtelomeric regions; low divergence states cover inner parts of autosomes; chromosome X forms its own state with lowest divergence; and a state of elevated microsatellite mutability is interspersed across the genome. These general trends are mirrored in human diversity data from the 1000 Genomes Project, and departures from them highlight the evolutionary history of primate chromosomes. We also find that genes and noncoding functional marks [annotations from the Encyclopedia of DNA Elements (ENCODE)] are concentrated in high divergence states. Our results provide a powerful tool for biomedical data analysis: segmentations can be used to screen personal genome variants--including those associated with cancer and other diseases--and to improve computational predictions of noncoding functional elements.
Conflict of interest statement
The authors declare no conflict of interest.
Figures


Similar articles
-
Estimating divergence time and ancestral effective population size of Bornean and Sumatran orangutan subspecies using a coalescent hidden Markov model.PLoS Genet. 2011 Mar;7(3):e1001319. doi: 10.1371/journal.pgen.1001319. Epub 2011 Mar 3. PLoS Genet. 2011. PMID: 21408205 Free PMC article.
-
Linking great apes genome evolution across time scales using polymorphism-aware phylogenetic models.Mol Biol Evol. 2013 Oct;30(10):2249-62. doi: 10.1093/molbev/mst131. Epub 2013 Aug 1. Mol Biol Evol. 2013. PMID: 23906727 Free PMC article.
-
Neutral substitutions occur at a faster rate in exons than in noncoding DNA in primate genomes.Genome Res. 2003 May;13(5):838-44. doi: 10.1101/gr.1152803. Genome Res. 2003. PMID: 12727904 Free PMC article.
-
Catarrhine primate divergence dates estimated from complete mitochondrial genomes: concordance with fossil and nuclear DNA evidence.J Hum Evol. 2005 Mar;48(3):237-57. doi: 10.1016/j.jhevol.2004.11.007. Epub 2005 Jan 20. J Hum Evol. 2005. PMID: 15737392 Review.
-
Mutation rate variation in the mammalian genome.Curr Opin Genet Dev. 2003 Dec;13(6):562-8. doi: 10.1016/j.gde.2003.10.008. Curr Opin Genet Dev. 2003. PMID: 14638315 Review.
Cited by
-
Systematic discovery of conservation states for single-nucleotide annotation of the human genome.Commun Biol. 2019 Jul 2;2:248. doi: 10.1038/s42003-019-0488-1. eCollection 2019. Commun Biol. 2019. PMID: 31286065 Free PMC article.
-
Evolution of Local Mutation Rate and Its Determinants.Mol Biol Evol. 2017 May 1;34(5):1100-1109. doi: 10.1093/molbev/msx060. Mol Biol Evol. 2017. PMID: 28138076 Free PMC article.
-
Lineage tracing of human development through somatic mutations.Nature. 2021 Jul;595(7865):85-90. doi: 10.1038/s41586-021-03548-6. Epub 2021 May 12. Nature. 2021. PMID: 33981037
-
The effects of chromatin organization on variation in mutation rates in the genome.Nat Rev Genet. 2015 Apr;16(4):213-23. doi: 10.1038/nrg3890. Epub 2015 Mar 3. Nat Rev Genet. 2015. PMID: 25732611 Free PMC article. Review.
-
Non-B DNA: a major contributor to small- and large-scale variation in nucleotide substitution frequencies across the genome.Nucleic Acids Res. 2021 Feb 22;49(3):1497-1516. doi: 10.1093/nar/gkaa1269. Nucleic Acids Res. 2021. PMID: 33450015 Free PMC article.
References
-
- Hodgkinson A, Eyre-Walker A. Variation in the mutation rate across mammalian genomes. Nat Rev Genet. 2011;12(11):756–766. - PubMed
-
- Hodgkinson A, Chen Y, Eyre-Walker A. The large-scale distribution of somatic mutations in cancer genomes. Hum Mutat. 2012;33(1):136–143. - PubMed
-
- Schuster-Böckler B, Lehner B. Chromatin organization is a major influence on regional mutation rates in human cancer cells. Nature. 2012;488(7412):504–507. - PubMed
Publication types
MeSH terms
Grants and funding
LinkOut - more resources
Full Text Sources
Other Literature Sources
Miscellaneous

