. 2013 Nov;154(11):4113-25.
doi: 10.1210/en.2012-2255. Epub 2013 Aug 19.

Maternal obesity enhances white adipose tissue differentiation and alters genome-scale DNA methylation in male rat offspring

Affiliations

Maternal obesity enhances white adipose tissue differentiation and alters genome-scale DNA methylation in male rat offspring

Sarah J Borengasser et al. Endocrinology. 2013 Nov.

Abstract

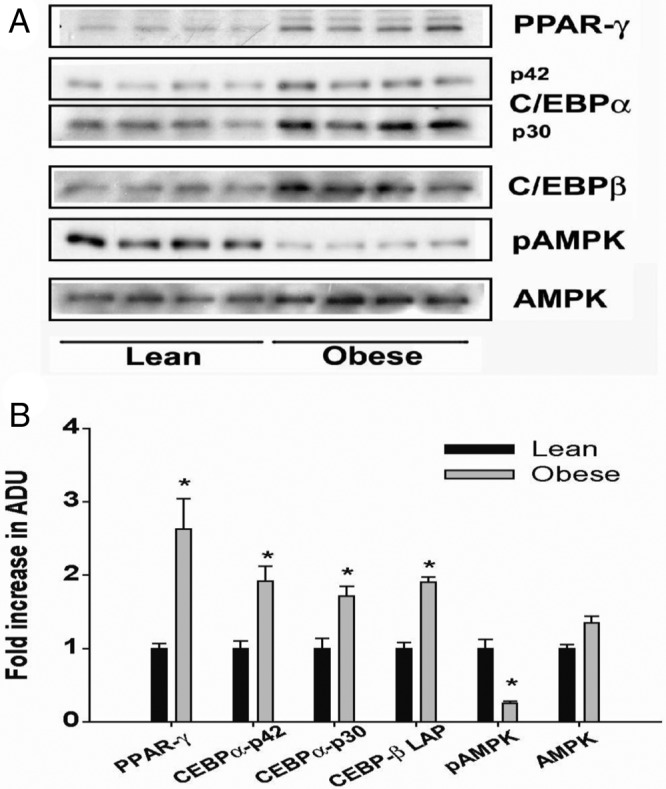
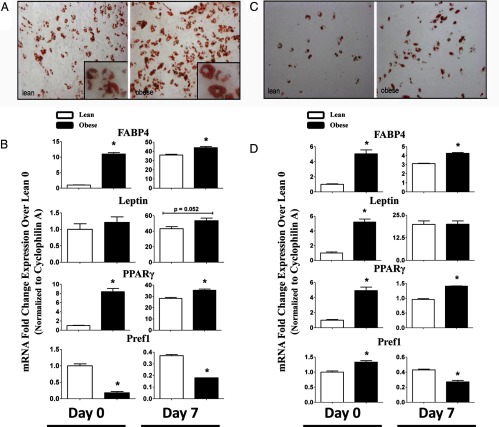
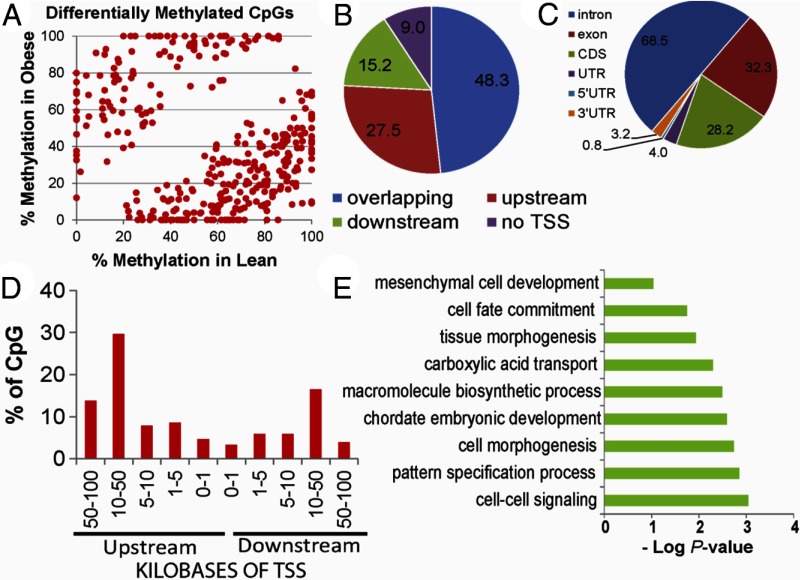
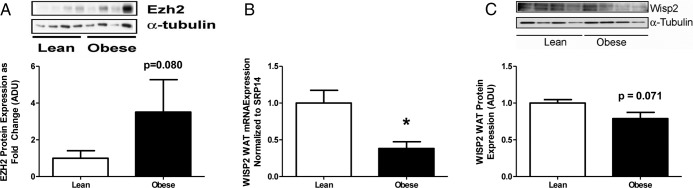
The risk of obesity (OB) in adulthood is strongly influenced by maternal body composition. Here we examined the hypothesis that maternal OB influences white adipose tissue (WAT) transcriptome and increases propensity for adipogenesis in the offspring, prior to the development of OB, using an established model of long-term metabolic programming. Employing an overfeeding-based rat model, in which exposure to OB is limited to preconception and gestation alone, we conducted global transcriptomic profiling in WAT, and gene/protein expression analysis of lipogenic and adipogenic pathways and examined adipogenic differentiation of WAT stromal-vascular cells ex vivo. Using reduced representation bisulfite sequencing we also evaluated genome-scale changes in DNA methylation in offspring WAT. Maternal OB led to extensive changes in expression of genes (± 1.8-fold, P ≤ .05), revealing a distinct up-regulation of lipogenic pathways in WAT. mRNA expression of a battery of sterol regulatory element-binding protein-1-regulated genes was increased in OB-dam offspring, which were confirmed by immunoblotting. In conjunction with lipogenic gene expression, OB-dam offspring showed increased glucose transporter-4 mRNA/protein expression and greater AKT phosphorylation following acute insulin challenge, suggesting sensitization of insulin signaling in WAT. Offspring of OB dams also exhibited increased in vivo expression of adipogenic regulators (peroxisome proliferator-activated receptor-γ, CCAAT enhancer binding protein α [C/EBP-α] and C/EBP-β), associated with greater ex vivo differentiation of WAT stromal-vascular cells. These transcriptomic changes were associated with alterations in DNA methylation of CpG sites and CGI shores, proximal to developmentally important genes, including key pro-adipogenic factors (Zfp423 and C/EBP-β). Our findings strongly suggest that the maternal OB in utero alters adipocyte commitment and differentiation via epigenetic mechanisms.


Figures

Figure 1.
Figure 1.
A, Hierarchical clustering of 258 transcripts altered by maternal OB in offspring adipose tissue. Gene expression was assessed in WAT at PND21 using Rat Genome 230 2.0 microarrays (n = 3 microarrays per group). Genes were filtered based on a minimum ± 1.8-fold change (OB vs lean) and P ≤ .05 using Student's t test. B, Correlation-based clustering of genes with functions in lipogenesis derived from a list of genes altered by maternal OB. Heat maps were generated using GeneSpring. Orange, yellow, and blue represent up-regulation, no relative effect, and down-regulation of transcripts, respectively. C, GSEA analysis of transcripts related to lipid biosynthesis enriched in WAT of OB-dam offspring. Red, white, and blue represent up-regulation, no relative effect, and down-regulation of transcripts, respectively. Enrichment of GO biological process terms for up-regulated (panel D) and down-regulated (panel E) genes due to maternal OB using GoRilla. GO terms are plotted against negative log of corrected P values. F, IPA gene network of highest significance form the list of altered genes. Red and green represent genes that are up- and down-regulated by maternal OB, respectively. G, Conceptgen analysis of differentially regulated genes by maternal OB reveals enrichment of lipid metabolism-related MeSH terms. *, P < 0.05.
Figure 2.
Figure 2.
mRNA Expression Genes Associated with Lipogenesis and Adipogenesis in WAT of Offspring from Lean (n = 8 pups from 7 litters) and OB (n = 8 pups from 5 litters) Dams at PND21 Gene expression was assessed via real-time RT-PCR. Statistical differences between litter means were determined using Student's t test. *, Significance P < 0.05. ACC1, acetyl-CoA carboxylase.
Figure 3.
Figure 3.
A, Immunoblots of lipogenesis-related and insulin signaling-related proteins (panel C) in total lysates from WAT of lean and OB dams at PND21 (n = 4 pools per group from 7 litters for lean and 5 litter for OB). B and D, Densitometric quantification of blots. E, Immunoblots of WAT lysates 5 minutes following acute insulin challenge administered through the hepatic portal vein (10 U/kg, n = 4–7; see Supplemental Table 1 for litters). Statistical differences were determined using Student's t test. *, Significance P < .05. ACC, acetyl-CoA carboxylase; ADU, arbitrary density units; GAPDH, glyceraldehyde 3-phosphate dehydrogenase.
Figure 4.
Figure 4.
Immunoblot analysis (A) and densitometric quantification (B) of adipogenesis-related proteins in total lysates from WAT of lean and OB dams at PND21 (n = 4 pools per group; see Supplemental Table 1 for litters). Statistical differences were determined using Student's t test. *, Significance, P < .05. ADU, arbitrary density units.
Figure 5.
Figure 5.
Representative Photomicrographs of Oil-Red-O-Stained SV Cells at Day 7 following Differentiation SV cells were isolated from offspring of lean and OB dams at PND21 (panel A) and PND100 (panel C). mRNA expression of genes associated with differentiation at PND21 (panel B) and PND100 (panel D) at day 0 and day 7. Gene expression is normalized to cyclophilin A mRNA and expressed as fold-change over levels in lean day 0. Statistical differences were determined using 2-way ANOVA followed by all pair-wise comparisons by Fisher least significant difference (LSD). Differing superscripts signify P < .05.
Figure 6.
Figure 6.
A, Scatter plot of 356 CpG sites showing differential methylation (DMS, P < .0005; Δme ≥10% between OB and lean offspring). Percent methylation at each CpG site was assessed using RRBS. Genomic localization of intergenic DMS (panel B), intragenic DMS (panel C), and distance from closest transcription start sites (panel D). E, Enrichment of GO biological processes in differentially methylated sites using GoRilla. GO terms are plotted against negative log of corrected P values. UTR, untranslated region.
Figure 7.
Figure 7.
A, Percent frequency distribution of methylation status of informative promoters (TSS), promoters containing CGI (TSS_CGI), all CGIs, CGI shores, and CGI shores associated with TSS in lean and OB-dam offspring. Number of informative features used to calculate distribution is given in parentheses above. Methylation status of features is binned into 5 categories (0%–20%, 20%–40%, and so on). Promoters mostly hypomethylated, whereas CGI shores show variable methylation distribution. B and C, Scatter plot and enrichment of GO terms for CGI shores (with TSS) showing at least a 15% difference in methylation. Only CGI shores with minimum of 3 CpGs with 5× coverage were included. CGI shores near C/EBP-β (panel D) and Zfp423 (panel E), showing decreased methylation in offspring of OB dams. From top, tracks showing gene and coding DNA sequence are in red, whereas CGI and CGI shores are in gray. Methylated CpGs are shown in red, and unmethylated CpGs are shown in blue. Percent methylation of shore for each group is presented in the respective track. F, mRNA expression of Zfp423 in SV cell isolated from the retroperitoneal fat pad of offspring from lean and OB dams. G, Immunoblot and densitometric quantification of Zfp423 in WAT from lean and OB-dam offspring. EGF, epidermal growth factor.
Figure 8.
Figure 8.
A, Immunoblot and densitometric quantification of Ezh2 in WAT from lean and OB-dam offspring. mRNA (B) and immunoblot and densitometric quantification (C) of WISP2 in WAT from lean and OB-dam offspring at PND21 (n = 4 pools per group; see Supplemental Table 1 for litters). Statistical differences were determined using Student's t test. *, Significance, P < .05.

References

    1. Flegal KM, Carroll MD, Kit BK, Ogden CL. Prevalence of obesity and trends in the distribution of body mass index among US adults, 1999–2010. JAMA. 2012;307:491–497 - PubMed
    1. Nathanielsz PW, Poston L, Taylor PD. In utero exposure to maternal obesity and diabetes: animal models that identify and characterize implications for future health. Clin Perinatol. 2007;34:515–526, v - PubMed
    1. Shankar K, Harrell A, Liu X, Gilchrist JM, Ronis MJ, Badger TM. Maternal obesity at conception programs obesity in the offspring. Am J Physiol Regul Integr Comp Physiol. 2008;294:R528–R538 - PubMed
    1. Shankar K, Kang P, Harrell A, et al. Maternal overweight programs insulin and adiponectin signaling in the offspring. Endocrinology. 2010;151:2577–2589 - PMC - PubMed
    1. McCurdy CE, Bishop JM, Williams SM, et al. Maternal high-fat diet triggers lipotoxicity in the fetal livers of nonhuman primates. J Clin Invest. 2009;119:323–335 - PMC - PubMed

Publication types