. 2013 Aug 19;202(4):623-36.
doi: 10.1083/jcb.201302123.

Aurora B and Kif2A control microtubule length for assembly of a functional central spindle during anaphase

Affiliations

Aurora B and Kif2A control microtubule length for assembly of a functional central spindle during anaphase

Ryota Uehara et al. J Cell Biol. .

Abstract

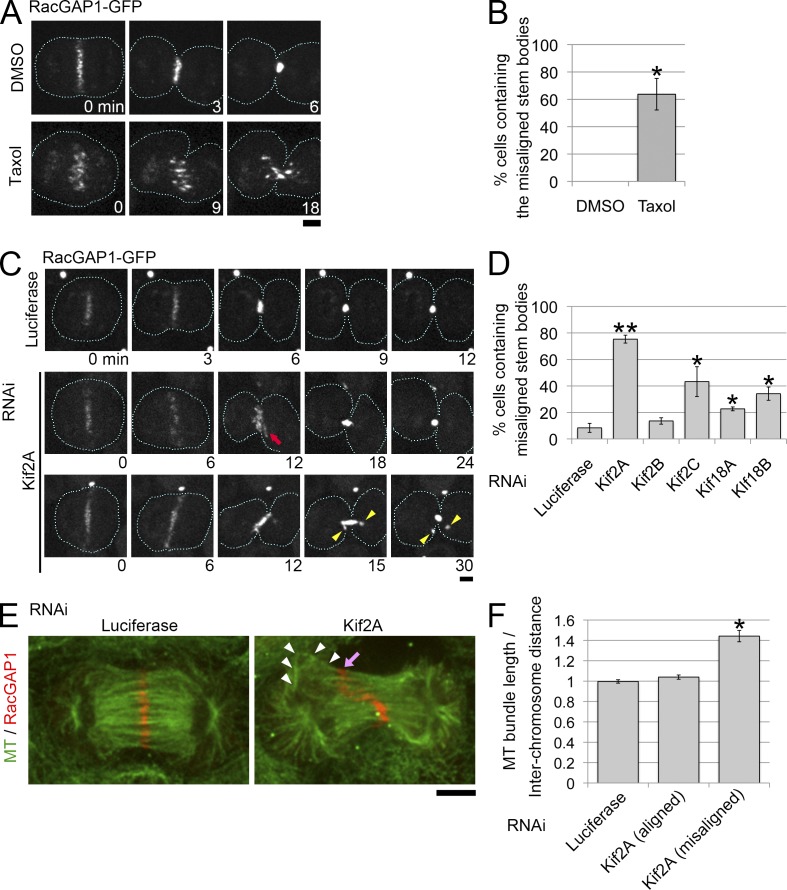
The central spindle is built during anaphase by coupling antiparallel microtubules (MTs) at a central overlap zone, which provides a signaling scaffold for the regulation of cytokinesis. The mechanisms underlying central spindle morphogenesis are still poorly understood. In this paper, we show that the MT depolymerase Kif2A controls the length and alignment of central spindle MTs through depolymerization at their minus ends. The distribution of Kif2A was limited to the distal ends of the central spindle through Aurora B-dependent phosphorylation and exclusion from the spindle midzone. Overactivation or inhibition of Kif2A affected interchromosomal MT length and disorganized the central spindle, resulting in uncoordinated cell division. Experimental data and model simulations suggest that the steady-state length of the central spindle and its symmetric position between segregating chromosomes are predominantly determined by the Aurora B activity gradient. On the basis of these results, we propose a robust self-organization mechanism for central spindle formation.


Figures

Figure 1.
Figure 1.
Kif2A is required for icMT sizing and organization. (A) Cells expressing RacGAP1-GFP were treated with DMSO (control) or 4 µM taxol for 5–10 min before image acquisition. (B) Frequency of stem body misalignment in DMSO- or taxol-treated cells. The mean ± SE of three independent experiments is shown (≥34 cells were analyzed for each treatment). *, P < 0.01, t test. (C) RacGAP1-GFP dynamics in control (luciferase RNAi) or Kif2A-depleted cells. (middle) Kif2A depletion resulted in stem body misalignment (red arrow) and broadening of the stem body cluster at early telophase (18 min). (bottom) Global misalignment of stem bodies resulted in formation of the perpendicularly tilted division plane. Some of the misaligned stem bodies were separated from the others during telophase (yellow arrowheads). Broken lines indicate cell boundaries. Note that the cell itself did not rotate during division plane rotation. (D) Frequency of stem body misalignment in control or kinesin-depleted cells. The mean ± SE of four (luciferase RNAi) or three (others) independent experiments is shown (≥26 cells were analyzed for each treatment). *, P < 0.01, t test; **, P < 10−4. (E) Immunostaining of MTs and RacGAP1 in control or Kif2A-depleted cells. A buckled MT bundle associated with a misaligned stem body (pink arrow) is highlighted with white arrowheads. (F) Ratio of MT bundle length to chromosome-to-chromosome distance in control or Kif2A-depleted cells. For Kif2A RNAi samples, the MT bundles associated with aligned or misaligned stem bodies were separately analyzed. The mean ratio (±SE) of ≥15 pairs of MT bundles in at least six cells from two independent experiments is shown. *, P < 10−7, t test. Bars, 5 µm.
Figure 2.
Figure 2.
Kif2A is involved in the depolymerization of central spindle MTs at their minus ends. (A and B) Shortening of central spindle MTs in control, but not Kif2A-depleted, cells expressing EGFP–α-tubulin after treatment with 200 ng/ml nocodazole (drug was added at time 0). The mean ± SE of at least six samples from two independent experiments is shown in B. (C) Scheme of the photobleaching assay. (D and E) EGFP–α-tubulin–expressing cells were treated with 1 µg/ml nocodazole immediately before image acquisition, and then, slit-shaped photobleach marks were introduced (red arrowheads). A time plot of the central spindle length and distance between two bleach marks. The mean ± SE of seven samples from three independent experiments is shown. Bars, 5 µm.
Figure 3.
Figure 3.
Aurora B controls the size and stability of the central spindle through regulation of Kif2A. (A) Immunostaining of MTs (green) and Kif2A (red) in control or Kif2A-depleted cells treated with or without 5 µM ZM447439 for 15 min. (B) Line profiles of the anti-Kif2A immunostaining intensity along the central spindle in control and ZM447439-treated cells. The mean ± SE of ≥12 cells from three independent experiments is shown. (C) Normalized fluorescence intensity of Kif2A immunostaining on the central spindle. Cells were either treated with 2.5 µM ZM447439 (ZM) for 3 or 10 min during anaphase or cultured without the drug for 30 min (DMSO) before fixation. The mean ± SE of ≥11 samples from two independent experiments is shown. *, P < 10−4, t test. (D) Length of the central spindle after treating cells with 5 µM ZM447439 for 15 min. The mean ± SE of three independent experiments is shown (≥45 cells were analyzed for each treatment). *, P < 0.001, t test. (E) EGFP–α-tubulin–expressing cells depleted of INCENP or codepleted of INCENP and Kif2A. In the absence of INCENP alone, the central spindle (red arrows) oscillated, and the cell later regressed. (F–H) Frequency of central spindle destabilization, furrow regression, or uneven chromosome distribution in control, Kif2A-depleted, INCENP-depleted, or Kif2A/INCENP-codepleted cells. For each sample, ≥47 cells from four independent experiments were analyzed. a.u., arbitrary unit. Bars, 5 µm.
Figure 4.
Figure 4.
Aurora B–dependent phosphorylation of Kif2A during cytokinesis. (A and B) Immunoblotting of GFP-Kif2A wild-type (WT) and mutant proteins that were immunoprecipitated (IP) from cells synchronized at the indicated stages of the cell cycle. Immunoprecipitated samples were subjected to Phos-tag SDS-PAGE followed by immunoblotting using anti-GFP antibody. Note that in the Phos-tag gel, mobility of GFP-Kif2A significantly decreased compared with that in a gel without Phos-tag, and the relative band position to those of molecular markers varied among experiments (see Materials and methods); however, the identical band pattern was reproducibly observed for GFP-Kif2A (n = 2 for each). Arrows indicate upper bands corresponding to phosphorylated GFP-Kif2A. (C) Immunostaining of MTs in cells expressing GFP-Kif2A mutants. (D) Normalized fluorescence intensity of GFP at the central spindle of the cells expressing GFP-Kif2A mutants. (E) Central spindle length in cells expressing GFP-Kif2A mutants. The mean ± SE of at least six cells from two independent experiments is shown in D and E. Asterisks indicate statistically significant differences from the control cells expressing wild-type GFP-Kif2A (P < 10−3, t test), or between the cells expressing GFP-Kif2A (T97A) and GFP-Kif2A (T97A/S157C; P < 0.05). (F and G) Destabilization and oscillation of the central spindle and cytokinesis failure upon GFP-Kif2A (T97A/S157C) or mKate2-Kif2A (T97A/S157C) expression. Arrows and arrowheads indicate the oscillating central spindle and the furrow edge, respectively. (H–J) Frequency of central spindle destabilization, furrow regression, or uneven chromosome distribution in cells expressing GFP-Kif2A mutants. For each mutant, ≥18 cells from seven independent experiments were analyzed. Cells expressing GFP-Kif2A mutants at a comparable level were used for quantification (mean GFP intensity of 100–300 or 100–400 arbitrary units for D and E or H–J, respectively; see also Fig. S3, C and D). Bars, 5 µm.
Figure 5.
Figure 5.
Mathematical modeling of central spindle organization by Aurora B gradient. (A) A schematic image of the central spindle in the 2D model. Pairs of MTs form antiparallel MT overlaps, where they slide apart (red arrows). MT growth and shrinkage occur at plus ends (blue and pink arrow, respectively). The Aurora B gradient (orange) forms around the stem body and inhibits MT depolymerization at minus ends (purple arrows), depending on their distance from the stem bodies. L, length of the antiparallel overlap. Sl and Sr, lengths of nonoverlapping portions. The interchromosomal area is flanked by rigid chromosome walls (light blue), and MTs buckle when their length exceeds the interchromosomal distance (the top MTs). (B and C) Time plots of simulated MT length (sum of L, Sl, and Sr) with various MT growth rates (Vgrowth) or Aurora B gradient sizes (σ). The mean of 25 MT pairs from five independent simulations is shown for each condition. (D) Stem body distributions after 1,000-s simulations. Shown are 200 stem bodies from 40 independent simulations. Closed circles indicate outliers that exceeded the length limit (see Materials and methods). (E) Time plots of simulated stem body positions with or without the Aurora B gradient. A stem body (stem body #3) was misaligned at the beginning of the simulation in both cases. Alignment of stem body #3 was observed only when the Aurora B gradient was present. The mean of five independent simulations is shown for each condition. The parameter values used in each simulation are presented in Table S4.
Figure 6.
Figure 6.
MKLP2 is required for proper Kif2A distribution and stem body alignment. (A) Immunostaining of Aurora B (middle) and Kif2A (bottom) in control or MKLP2-depleted cells. (B) Line profiles of anti-Kif2A immunostaining along the central spindle in control and MKLP2-depleted cells. The mean ± SE of ≥36 cells from two independent experiments is shown. (C) Control and MKLP2-depleted cells expressing RacGAP1-GFP. Red arrows indicate misaligned stem bodies. Broken lines indicate cell boundaries. (D) The mean ± SE of three independent experiments is shown (≥62 cells were analyzed in each experiment). *, P < 0.05, t test. a.u., arbitrary unit. Bars, 5 µm.
Figure 7.
Figure 7.
Kif2A-mediated central spindle sizing for cytokinesis. (A) EGFP–α-tubulin cells codepleted of Kif2A and MKLP1. Cells regressed during or after furrow ingression (labeled as early or late regression, respectively). Bar, 5 µm. (B) Frequency of early or late regression in each sample. For each treatment, ≥50 cells from two independent experiments were analyzed. (C) Model for central spindle sizing by Kif2A and Aurora B. The Aurora B activity gradient is formed around stem bodies. In the region where Aurora B concentration is high, Kif2A is inactivated through phosphorylation on T97, whereas it actively depolymerizes MT ends outside the region. This mechanism prevents overshortening of icMTs and guarantees proper sizing of icMTs.

References

    1. Amaro A.C., Samora C.P., Holtackers R., Wang E., Kingston I.J., Alonso M., Lampson M., McAinsh A.D., Meraldi P. 2010. Molecular control of kinetochore-microtubule dynamics and chromosome oscillations. Nat. Cell Biol. 12:319–329 10.1038/ncb2033 - DOI - PMC - PubMed
    1. Andrews P.D., Ovechkina Y., Morrice N., Wagenbach M., Duncan K., Wordeman L., Swedlow J.R. 2004. Aurora B regulates MCAK at the mitotic centromere. Dev. Cell. 6:253–268 10.1016/S1534-5807(04)00025-5 - DOI - PubMed
    1. Bieling P., Telley I.A., Surrey T. 2010. A minimal midzone protein module controls formation and length of antiparallel microtubule overlaps. Cell. 142:420–432 10.1016/j.cell.2010.06.033 - DOI - PubMed
    1. Brust-Mascher I., Civelekoglu-Scholey G., Kwon M., Mogilner A., Scholey J.M. 2004. Model for anaphase B: role of three mitotic motors in a switch from poleward flux to spindle elongation. Proc. Natl. Acad. Sci. USA. 101:15938–15943 10.1073/pnas.0407044101 - DOI - PMC - PubMed
    1. Carmena M., Wheelock M., Funabiki H., Earnshaw W.C. 2012. The chromosomal passenger complex (CPC): from easy rider to the godfather of mitosis. Nat. Rev. Mol. Cell Biol. 13:789–803 10.1038/nrm3474 - DOI - PMC - PubMed

Publication types