. 2013 Aug 26;210(9):1823-37.
doi: 10.1084/jem.20122332. Epub 2013 Aug 19.

IL-25 simultaneously elicits distinct populations of innate lymphoid cells and multipotent progenitor type 2 (MPPtype2) cells

Affiliations

IL-25 simultaneously elicits distinct populations of innate lymphoid cells and multipotent progenitor type 2 (MPPtype2) cells

Steven A Saenz et al. J Exp Med. .

Abstract

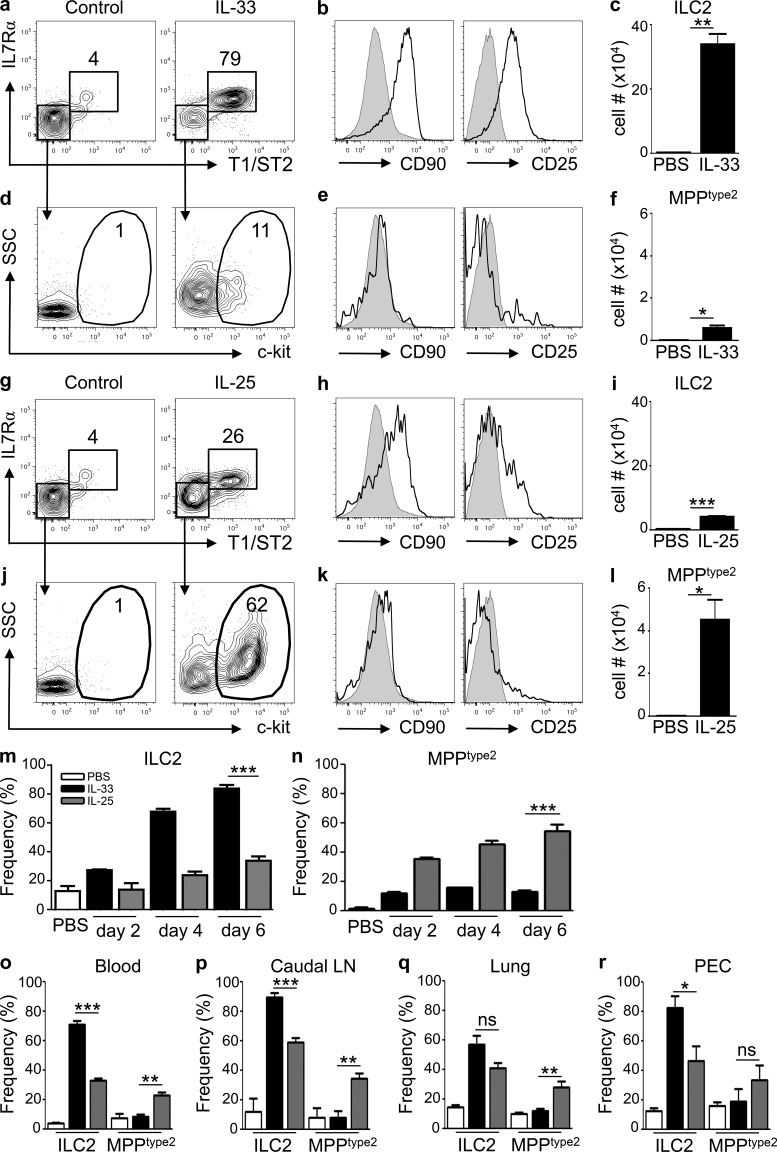
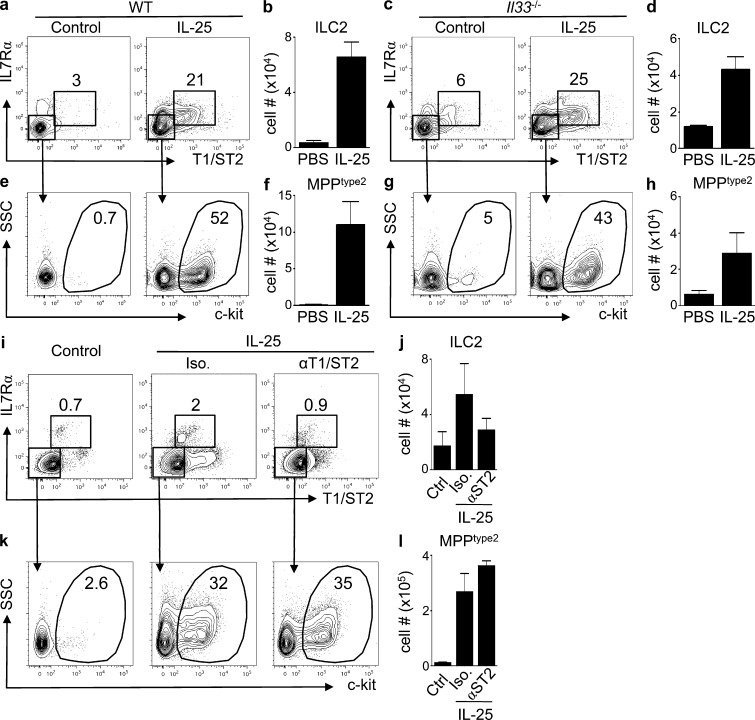
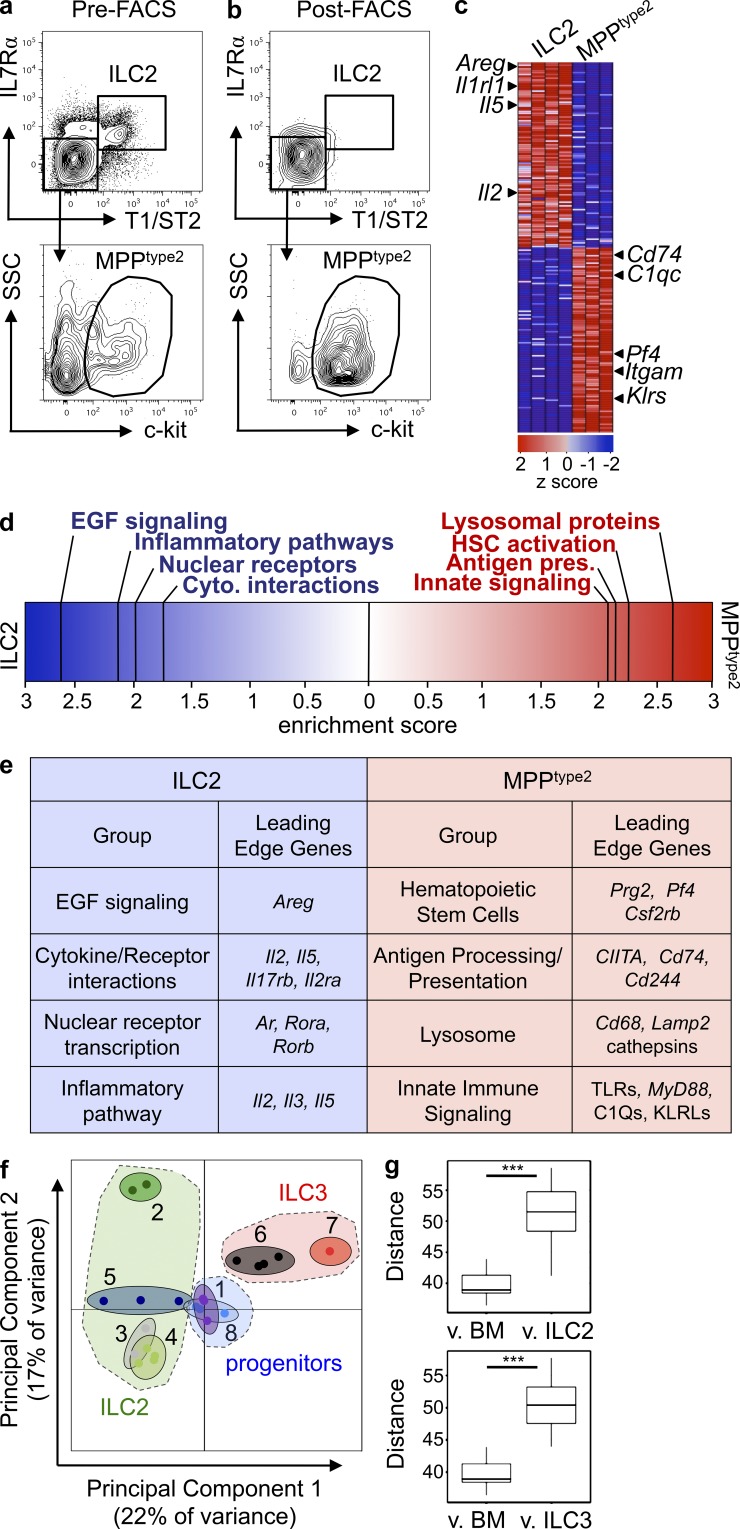
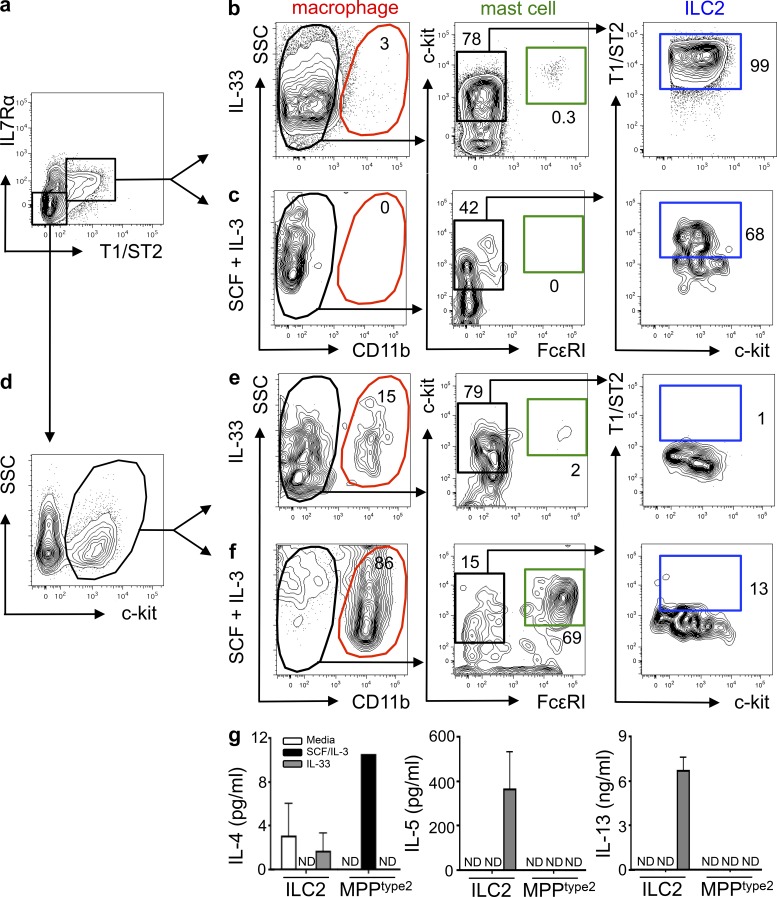
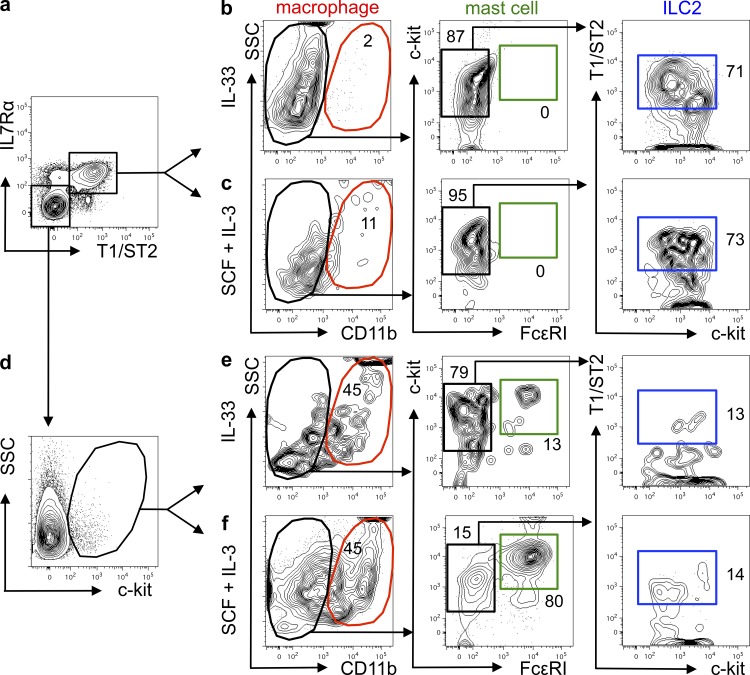
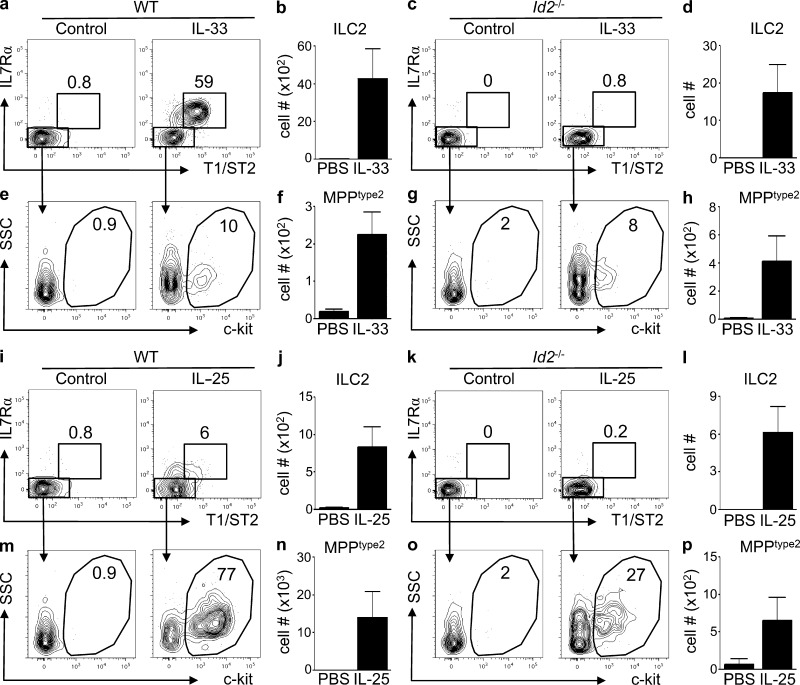
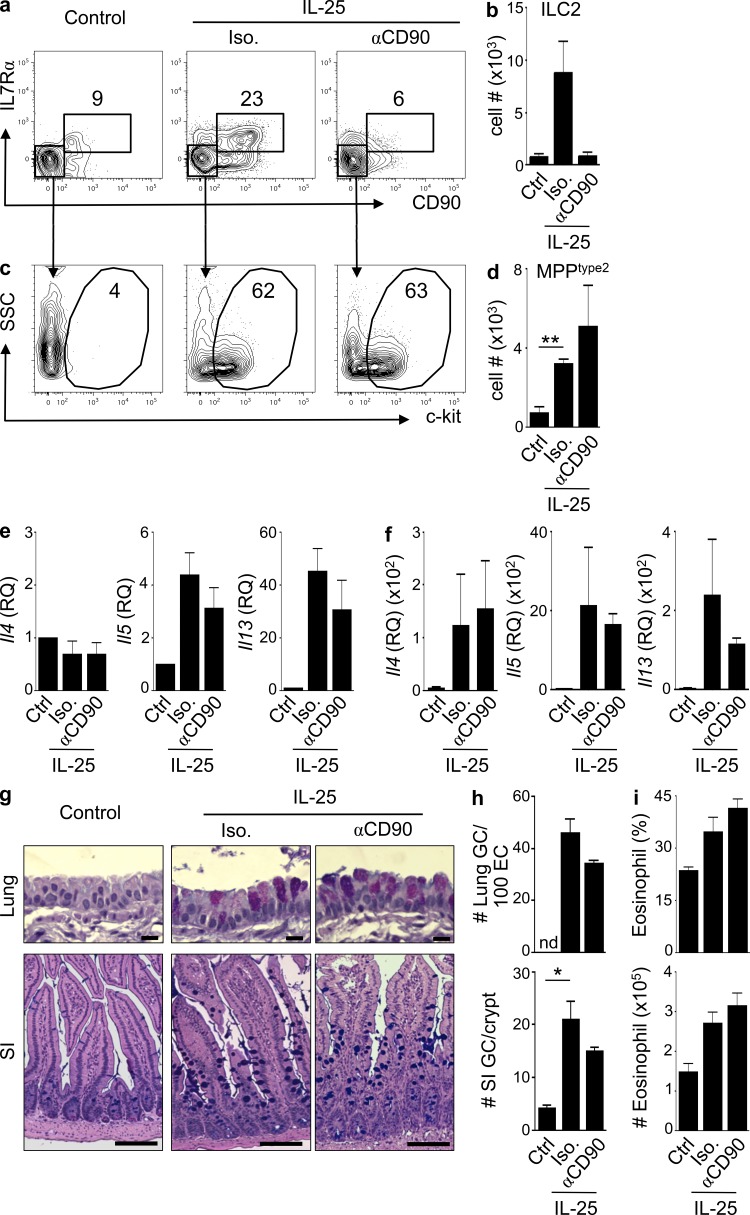
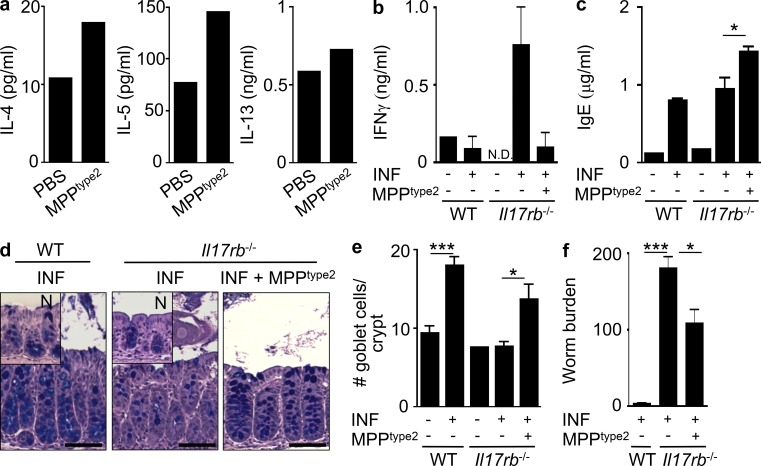
The predominantly epithelial cell-derived cytokines IL-25, IL-33, and thymic stromal lymphopoietin (TSLP) can promote CD4(+) Th2 cell-dependent immunity, inflammation, and tissue repair at barrier surfaces through the induction of multiple innate immune cell populations. IL-25 and IL-33 were previously shown to elicit four innate cell populations, named natural helper cells, nuocytes, innate type 2 helper cells, and multipotent progenitor type 2 (MPP(type2)) cells, now collectively termed group 2 innate lymphoid cells (ILC2). In contrast to other types of ILC2, MPP(type2) cells exhibit multipotent potential and do not express T1/ST2 or IL-7Rα, suggesting that MPP(type2) cells may be a distinct population. Here, we show that IL-33 elicits robust ILC2 responses, whereas IL-25 predominantly promotes MPP(type2) cell responses at multiple tissue sites with limited effects on ILC2 responses. MPP(type2) cells were distinguished from ILC2 by their differential developmental requirements for specific transcription factors, distinct genome-wide transcriptional profile, and functional potential. Furthermore, IL-25-induced MPP(type2) cells promoted Th2 cytokine-associated inflammation after depletion of ILC2. These findings indicate that IL-25 simultaneously elicits phenotypically and functionally distinct innate lymphoid- and nonlymphoid-associated cell populations and implicate IL-25-elicited MPP(type2) cells and extramedullary hematopoiesis in the promotion of Th2 cytokine responses at mucosal surfaces.


Figures

Figure 1.
Figure 1.
IL-25 simultaneously elicits phenotypically distinct populations of MPPtype2 cells and ILC2. (a–r) C57BL/6 WT mice (The Jackson Laboratory) were treated i.p. with PBS (control), 0.3 µg of recombinant IL-33, or 0.3 µg of recombinant IL-25 daily for 2, 4, or 7 d. Indicated tissues were harvested at day 7 (or as indicated), and the frequency and total cell numbers of ILC2 and MPPtype2 cells were assessed by flow cytometry. (a) Frequency of T1/ST2pos IL-7Rαpos ILC2 in the Linneg cell compartment from the MLNs of control or IL-33–treated mice. (b) CD90.2 (Thy1.2) and CD25 expression on ILC2 (black histograms) from IL-33–treated mice. (c) Total cell numbers of ILC2 from control or IL-33–treated mice. (d) Expression of c-kit on gated T1/ST2neg IL-7Rαneg cells from control or IL-33–treated mice. (e) CD90 and CD25 expression on c-kitpos MPPtype2 cells (black histograms) from IL-33–treated mice. (f) Total cell numbers of MPPtype2 cells from control or IL-33–treated mice. (g) Frequency of ILC2 in the Linneg cell compartment from the MLN of control or IL-25–treated mice. (h) CD90 and CD25 expression on ILC2 (black histograms) from IL-25–treated mice. (i) Total cell numbers of ILC2 from control or IL-25–treated mice. (j) Expression of c-kit on gated T1/ST2neg IL-7Rαneg cells from control or IL-25–treated mice. (k) CD90 and CD25 expression on c-kitpos MPPtype2 cells (black histograms) from IL-25–treated mice. (l) Total cell numbers of MPPtype2 cells from control or IL-25–treated mice. Plots are gated on live, Linneg (CD4, CD8, CD11b, CD11c, and CD19) cells or as indicated. Gray shaded histograms represent CD90 or CD25 expression on Linneg cells from control mice. (m and n) Frequencies of ILC2 (m) or MPPtype2 cells (n) as gated in a, g, d, and i from the MLNs of control (open bars), IL-33–treated, or IL-25–treated mice at days 2, 4, and 6. (o–r) Frequencies of ILC2 and MPPtype2 cells as gated in a and g and d and i from the blood (o), caudal LN (p), lung (q), and PEC (r) of control (open bars), IL-33–treated (black bars), or IL-25–treated (gray bars) mice at day 6. Data in a–n are representative of two or more independent experiments (control, n = 4; IL-33 treated, n = 8; IL-25 treated, n = 8). Data in o–r are representative of two independent experiments (control, n = 4; IL-25 treated, n = 8; IL-33 treated, n = 8). *, P < 0.05; **, P < 0.01; ***, P < 0.0001. Lung IL-33–elicited ILC2 versus IL-25–elicited ILC2, P = 0.07; PEC IL-33–elicited MPPtype2 cells versus IL-25–elicited MPPtype2 cells, P = 0.31. Error bars indicate SEM.
Figure 2.
Figure 2.
IL-25 elicits ILC2 and MPPtype2 cells independent of IL-33 signaling. (a–d) C57BL/6 WT mice and C57BL/6 Il33−/− mice (Taconic) were treated i.p. with PBS (control) or 0.3 µg of recombinant IL-25 daily for 7 d. MLNs were harvested at day 7, and the frequency and total cell numbers of ILC2 and MPPtype2 cells were assessed by flow cytometry. (a and c) Frequency of ILC2 in control or IL-25–treated WT (a) or Il33−/− mice (c). (b and d) Total cell numbers of ILC2 in control or IL-25–treated WT (b) or Il33−/− mice (d). (e and g) Frequency of MPPtype2 cells in control or IL-25–treated WT (e) or Il33−/− mice (g). (f and h) Total cell numbers of MPPtype2 cells in control or IL-25–treated WT (f) or Il33−/− mice (h). Data in a–h are representative of two independent experiments (control, n = 4; IL-25–treated WT, n = 6; IL-25–treated Il33−/−, n = 6). (i–l) BALB/c WT mice (The Jackson Laboratory) were treated with PBS (control) or 0.3 µg of recombinant IL-25 plus isotype (IgG) or anti-T1/ST2 mAbs. MLNs were harvested at day 7, and the frequency and total cell numbers of ILC2 and MPPtype2 cells were assessed by flow cytometry. Frequency and total numbers of T1/ST2pos IL-7Rαpos ILC2 (i and j) and T1/ST2neg IL-7Rαneg c-kitpos MPPtype2 cells (k and l). Plots are gated on live, Linneg (CD4, CD8α, CD11b, CD11c, and CD19) cells. Data in i–l are representative of two independent experiments (control, n = 6; IL-25 treated, n = 9; anti-T1/ST2 IL-25 treated, n = 9). Error bars indicate SEM.
Figure 3.
Figure 3.
IL-25–elicited MPPtype2 cells possess a unique transcriptional profile from ILC2 cells. (a and b) C57BL/6 WT mice (The Jackson Laboratory) were treated with 0.3 µg of recombinant IL-25 daily for 7 d. MLNs and PECs were harvested from IL-25–treated mice and MPPtype2 cells (Linneg T1/ST2neg IL-7Rαneg CD4neg CD90neg CD25neg c-kitpos; a) were FACS purified to ≥95% purity (b). Three biological replicates of MPPtype2 cells were collected, and mRNA was isolated, amplified, and hybridized to Affymetrix gene chips for microarray analysis. The previously published microarray gene expression profile of lung-resident ILC2 was used for comparison (GEO series no. GSE46468; Monticelli et al., 2011). (c) Heat map representing gene expression profiles of the top 100 differentially expressed genes between MPPtype2 cells and ILC2. Red indicates high expression, and blue indicates low expression. (d) GSEA comparing the gene expression signatures of MPPtype2 cells and ILC2. (e) List of leading edge genes from GSEA analysis from d. (f) PCA plot comparing transcriptional profiles for MPPtype2 cells (1), ex vivo nuocytes (2; GSE25890), NHCs (3; GSE18752), lung-resident ILC2 (4; GSE46468), unstimulated lung NHCs (5; GSE36057), splenic LTi cells (6, GSE46468; and 7, GSE18752), and BM-GMPs (8). Categories of ILC2 (green shaded area), ILC3 (red shaded area), and progenitors (blue shaded area) were grouped (as indicated in f, dashed lines), and Euclidean distance measurements between MPPtype2 cells and BM-GMP versus ILC2 or ILC3 were calculated (g). ***, P < 0.0001. MPPtype2 cells versus BM-GMP versus ILC2, P = 8.5 × 10⁻⁸; MPPtype2 cells versus BM-GMP versus ILC3s, P = 3.1 × 10⁻⁶.
Figure 4.
Figure 4.
IL-25–elicited MPPtype2 cells, but not ILC2, possess multipotent potential. BALB/c WT mice (The Jackson Laboratory) were treated with 0.3 µg of recombinant IL-25 daily for 7 d. MLNs and PECs were harvested from IL-25–treated mice, and ILC2 and MPPtype2 cells were sort-purified and cultured in the presence of IL-33 alone or SCF plus IL-3. (a and d) FACS purification gating of ILC2 (Linneg T1/ST2pos IL-7Rαpos; a) or MPPtype2 cells (Linneg T1/ST2neg IL-7Rαneg c-kitpos; d) from IL-25–treated mice. Plots shown are gated on live, Linneg cells (CD3ε, CD8α, CD19, CD11b, CD11c, Gr-1). (b and c) Flow cytometric analysis of myeloid, granulocyte, and ILC2 cell differentiation of day 8–12 cultures seeded with FACS-purified ILC2 in the presence of IL-33 (b) or SCF and IL-3 (c). (e and f) Flow cytometric analysis of macrophage, granulocyte, and ILC2 cell differentiation of day 8–12 cultures seeded with FACS-purified MPPtype2 cells in the presence of IL-33 (e) or SCF and IL-3 (f). (g) Culture supernatants from b, c, e, and f were collected, and IL-4, IL-5, and IL-13 protein levels were measured by ELISA. Data in a–g are representative of at least three independent experiments. Error bars indicate SEM.
Figure 5.
Figure 5.
IL-33–elicited MPPtype2 cells, but not ILC2, possess multipotent potential. BALB/c WT mice (The Jackson Laboratory) were treated with 0.3 µg of recombinant IL-33 daily for 7 d. MLNs and PECs were harvested from IL-33–treated mice, and ILC2 and MPPtype2 cells were sort-purified and cultured in the presence of IL-33 alone or SCF plus IL-3. (a and d) FACS purification gating of ILC2 (Linneg T1/ST2pos IL-7Rαpos; a) or MPPtype2 cells (Linneg T1/ST2neg IL-7Rαneg c-kitpos; d) from IL-33–treated mice. Plots shown are gated on live, Linneg cells (CD3ε, CD8α, CD19, CD11b, CD11c, and Gr-1). (b and c) Flow cytometric analysis of myeloid, granulocyte, and ILC2 cell differentiation of day 8–12 cultures seeded with FACS-purified ILC2 in the presence of IL-33 (b) or SCF and IL-3 (c). (e and f) Flow cytometric analysis of myeloid, granulocyte, and ILC2 cell differentiation of day 8 cultures seeded with FACS-purified MPPtype2 cells in the presence of IL-33 (e) or SCF and IL-3 (f). Data in a–f are representative of at least two independent experiments.
Figure 6.
Figure 6.
IL-25–mediated induction of MPPtype2 cells occurs independently of Id2. (a–p) CD5/B220-depleted donor BM (WT, CD45.1; Id2−/−, CD45.1.2) was transferred into lethally irradiated C57BL/6 WT (CD45.2) mice. After reconstitution for 8 wk after transplant, mice were treated i.p. with PBS (control), 0.3 µg of recombinant IL-33, or 0.3 µg of recombinant IL-25 daily for 7 d. MLNs were harvested, and the frequency and total cell numbers of ILC2 and MPPtype2 cells were assessed by flow cytometry. (a and c) Frequency of T1/ST2pos IL-7Rαpos ILC2 from control or IL-33–treated WT BM chimera mice (a) or Id2-deficient BM chimera mice (c). (b and d) Total cell numbers of ILC2 from control or IL-33–treated WT BM chimera mice (b) or Id2-deficient BM chimera mice (d). (e and g) Frequency of c-kitpos MPPtype2 cells from control or IL-33–treated WT BM chimera mice (e) or Id2-deficient BM chimera mice (g). (f and h) Total cell numbers of MPPtype2 cells from control or IL-33–treated WT BM chimera mice (f) or Id2-deficient BM chimera mice (h). (i and k) Frequency of T1/ST2pos IL-7Rαpos ILC2 cells from control or IL-25–treated WT BM chimera mice (i) or Id2-deficient BM chimera mice (k). (j and l) Total cell numbers of ILC2 from control or IL-25–treated WT BM chimera mice (j) or Id2-deficient BM chimera mice (l). (m and o) Frequency of c-kitpos MPPtype2 cells from control or IL-25–treated WT BM chimera mice (m) or Id2-deficient BM chimera mice (o). (n and p) Total cell numbers of MPPtype2 cells from control or IL-25–treated WT BM chimera mice (n) or Id2-deficient BM chimera mice (p). Plots are gated on live, Linneg (CD4, CD8, CD11b, CD11c, and CD19) donor-derived cells. Data in a–p are representative of two or more independent experiments (control, n = 4; IL-33 treated, n = 6; IL-25 treated, n = 6). Error bars indicate SEM.
Figure 7.
Figure 7.
IL-25–mediated induction of MPPtype2 cells and type 2 inflammation occurs independently of ILC2. (a–i) C57BL/6 Rag1−/− mice (The Jackson Laboratory) were treated i.p. with PBS (control) or 0.3 µg of IL-25 plus isotype mAb (Iso.) or anti-CD90 mAb. (a and b) Frequencies (a) and total cell numbers (b) of CD90pos T1/ST2pos IL-7Rαpos ILC2 in the MLNs of control or IL-25–treated mice given either isotype or anti-CD90 mAb. (c and d) Frequencies (c) and total cell numbers (d) of CD90neg T1/ST2neg IL-7Rαneg MPPtype2 cells in the MLNs of control or IL-25–treated mice given either isotype or anti-CD90 mAb. Plots are gated on live, Linneg (CD4, CD8, CD11b, CD11c, and CD19) cells or as indicated. (e and f) Quantitative real-time PCR of Il4, Il5, and Il13 gene expression levels from lung (e) or small intestinal tissue (f) of control or IL-25–treated mice receiving either isotype or anti-CD90 mAb. RQ, relative quantification. (g) Periodic acid–Schiff/Alcian blue staining of lung and small intestine (SI) tissue from control or IL-25–treated mice receiving either isotype or anti-CD90 mAb. Bars: (top) 50 µm; (bottom) 100 µm. (h) Goblet cell (GC) counts from g. nd, not detected. (i) Frequency and total cell numbers of eosinophils in the lung from control or IL-25–treated mice given either isotype or anti-CD90 mAb. Frequency is percentage of SSChi SiglecFpos cells gated on live, Linneg CD11bpos cells. Data in a–i are representative of three independent experiments (control + Iso., n = 6; control + anti-CD90, n = 6; IL-25 treated + Iso., n = 6; IL-25 treated + anti-CD90, n = 6). *, P < 0.05; **, P < 0.01. Control ILC2 versus IL-25 + Iso. ILC2, P = 0.057; IL-25 + Iso. ILC2 versus IL-25 + αCD90 ILC2, P = 0.059; IL-25 + Iso. MPPtype2 versus IL-25 + αCD90 MPPtype2, P = 0.41; lung GC#: IL-25 + Iso. versus IL-25 + αCD90, P = 0.10; SI GC#: IL-25 + Iso. versus IL-25 + αCD90, P = 0.16. Error bars indicate SEM.
Figure 8.
Figure 8.
IL-25–elicited MPPtype2 cells promote Th2 cytokine–dependent responses in vivo. C57BL/6 WT mice (The Jackson Laboratory) were treated i.p. with 0.3 µg IL-25 daily for 7 d. MLNs were harvested, and MPPtype2 cells were sort-purified and injected intradermally into naive C57BL/6 WT mice. (a) IL-4, IL-5, and IL-13 cytokine production from skin-draining LN cells from mice receiving intradermal injection of control or IL-25–elicited MPPtype2 cells after 48-h αCD3/αCD28 stimulation measured by ELISA. Data in a are representative of two independent experiments. (b–f) C57BL/6 WT mice were treated i.p. with 0.3 µg IL-25 daily for 7 d. MLNs were harvested, and MPPtype2 cells were sort-purified and injected into T. muris–infected (INF) Il17rb−/− mice (Charles River). (b) IFN-γ cytokine production by T. muris antigen–stimulated MLN cells. (c) Total serum IgE antibody titers measured by ELISA. (d) Periodic acid–Schiff/Alcian blue–stained colon sections of intestine tissue from naive or infected WT or Il17rb−/− mice ± MPPtype2 cells. N, naive (inset). Bars, 100 µm. (e) Goblet cell counts from d. (f) Worm burdens from T. muris–infected mice were assessed at day 21 after infection. Data in b–f are representative of two independent experiments (WT naive, n = 2–3; WT INF, n = 6–8; Il17rb−/− naive, n = 2–3; Il17rb−/− INF, n = 6–7; Il17rb−/− INF + MPPtype2 cells, n = 6). *, P < 0.05; ***, P < 0.001. IFN-γ production between Il17rb−/− INF and Il17rb−/− INF + MPPtype2 cells, P = 0.068. Error bars indicate SEM.

References

    1. Al-Shami A., Spolski R., Kelly J., Fry T., Schwartzberg P.L., Pandey A., Mackall C.L., Leonard W.J. 2004. A role for thymic stromal lymphopoietin in CD4+ T cell development. J. Exp. Med. 200:159–168 10.1084/jem.20031975 - DOI - PMC - PubMed
    1. Allakhverdi Z., Comeau M.R., Jessup H.K., Yoon B.R., Brewer A., Chartier S., Paquette N., Ziegler S.F., Sarfati M., Delespesse G. 2007. Thymic stromal lymphopoietin is released by human epithelial cells in response to microbes, trauma, or inflammation and potently activates mast cells. J. Exp. Med. 204:253–258 10.1084/jem.20062211 - DOI - PMC - PubMed
    1. Allakhverdi Z., Comeau M.R., Smith D.E., Toy D., Endam L.M., Desrosiers M., Liu Y.J., Howie K.J., Denburg J.A., Gauvreau G.M., Delespesse G. 2009. CD34+ hemopoietic progenitor cells are potent effectors of allergic inflammation. J. Allergy Clin. Immunol. 123:472–478 10.1016/j.jaci.2008.10.022 - DOI - PubMed
    1. Anthony R.M., Rutitzky L.I., Urban J.F., Jr, Stadecker M.J., Gause W.C. 2007. Protective immune mechanisms in helminth infection. Nat. Rev. Immunol. 7:975–987 10.1038/nri2199 - DOI - PMC - PubMed
    1. Barlow J.L., Bellosi A., Hardman C.S., Drynan L.F., Wong S.H., Cruickshank J.P., McKenzie A.N. 2012. Innate IL-13-producing nuocytes arise during allergic lung inflammation and contribute to airways hyperreactivity. J. Allergy Clin. Immunol. 129:191–198 10.1016/j.jaci.2011.09.041 - DOI - PubMed

Publication types

MeSH terms