Comparative Study
. 2015 Jan;25(1):147-60.
doi: 10.1093/cercor/bht214. Epub 2013 Aug 19.

Systematic, cross-cortex variation in neuron numbers in rodents and primates

Affiliations
Comparative Study

Systematic, cross-cortex variation in neuron numbers in rodents and primates

Christine J Charvet et al. Cereb Cortex. 2015 Jan.

Abstract

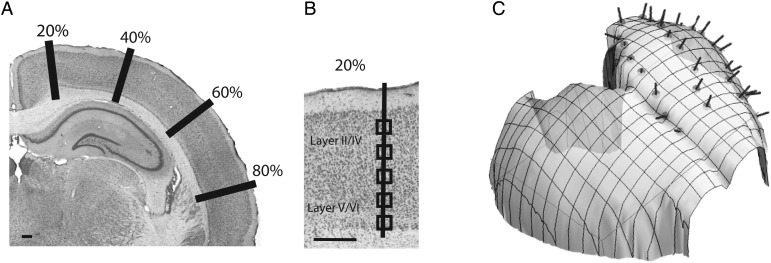
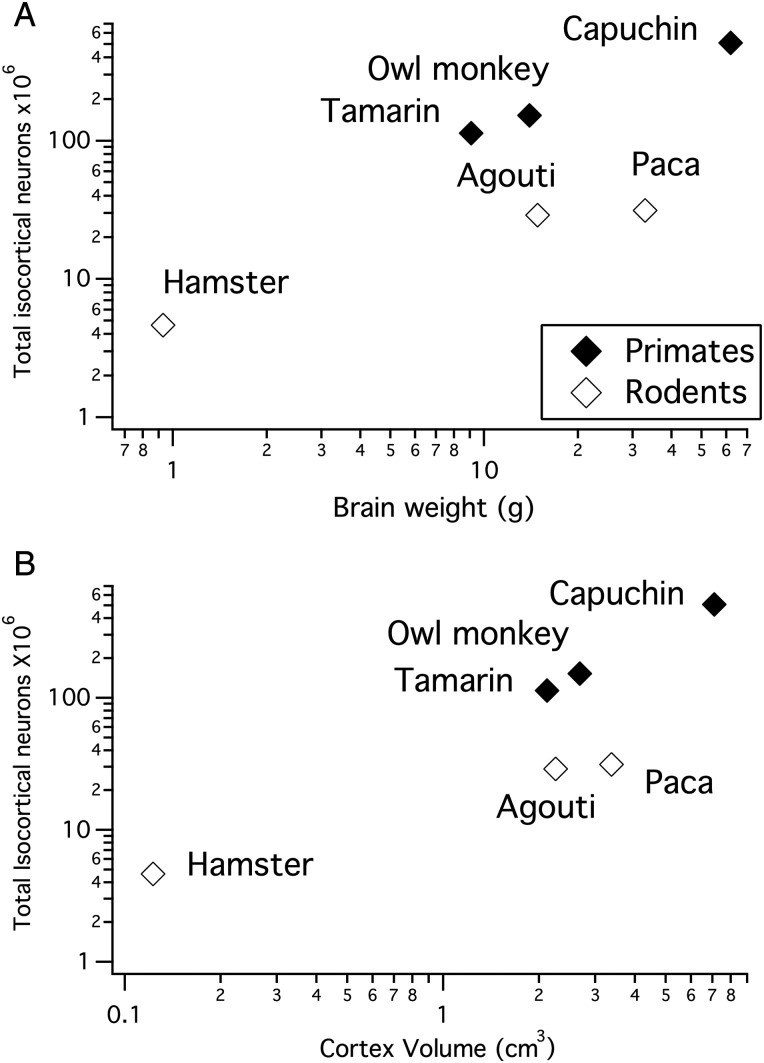
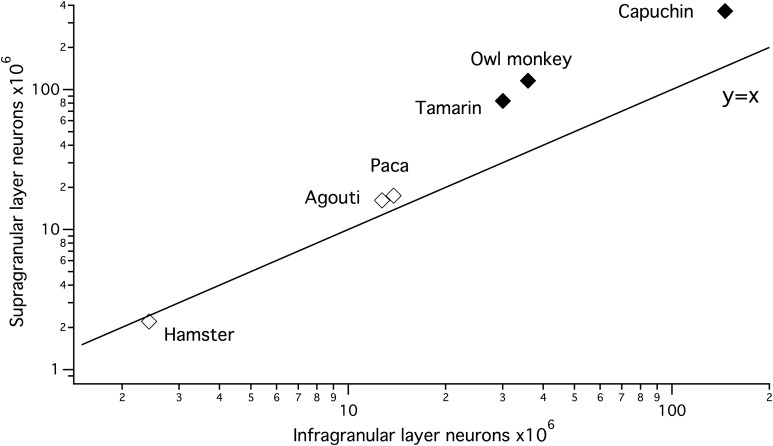
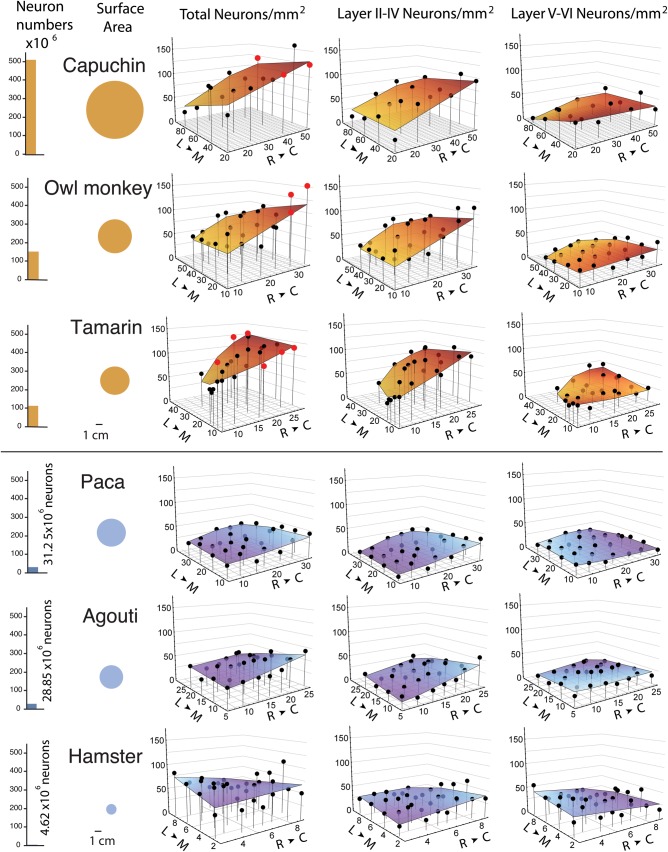
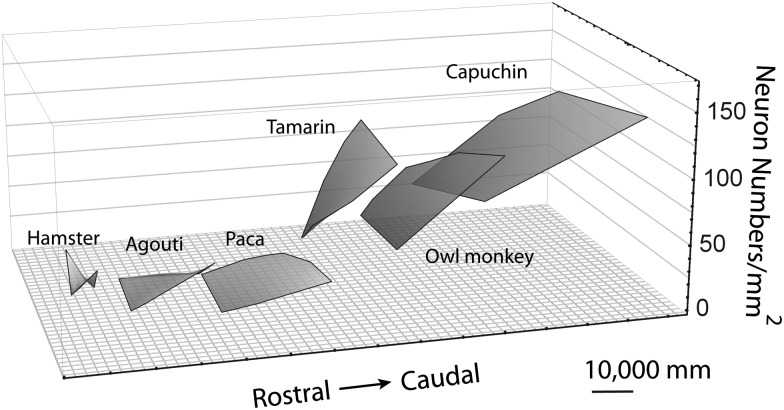
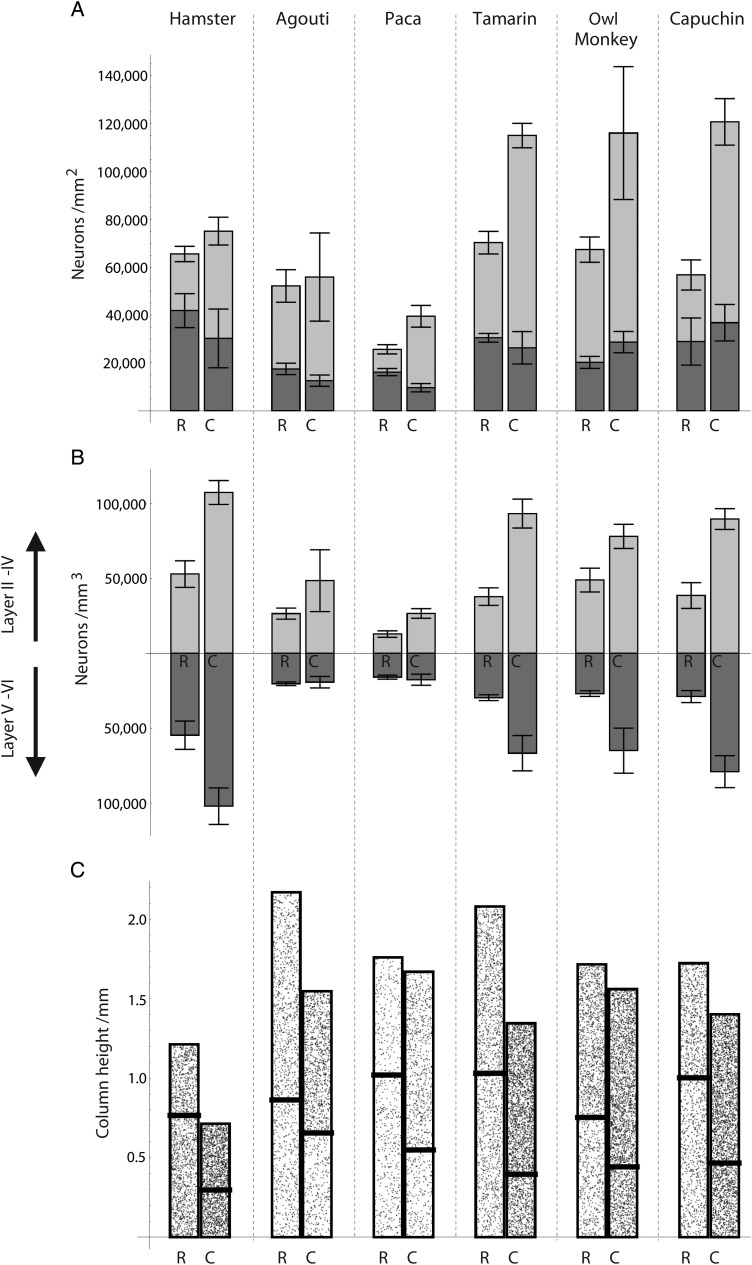
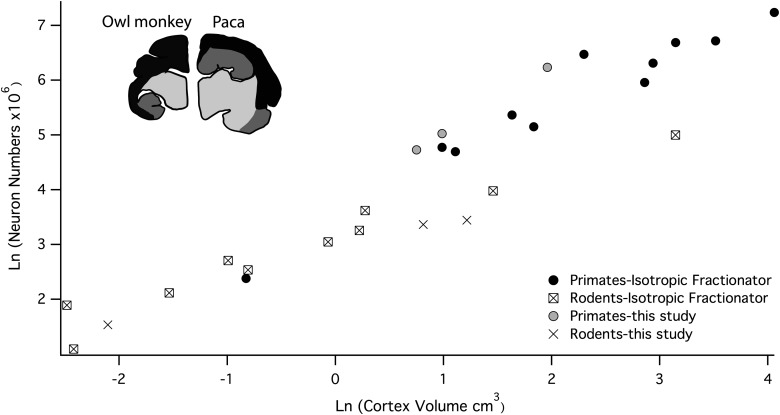
Uniformity, local variability, and systematic variation in neuron numbers per unit of cortical surface area across species and cortical areas have been claimed to characterize the isocortex. Resolving these claims has been difficult, because species, techniques, and cortical areas vary across studies. We present a stereological assessment of neuron numbers in layers II-IV and V-VI per unit of cortical surface area across the isocortex in rodents (hamster, Mesocricetus auratus; agouti, Dasyprocta azarae; paca, Cuniculus paca) and primates (owl monkey, Aotus trivigratus; tamarin, Saguinus midas; capuchin, Cebus apella); these chosen to vary systematically in cortical size. The contributions of species, cortical areas, and techniques (stereology, "isotropic fractionator") to neuron estimates were assessed. Neurons per unit of cortical surface area increase across the rostro-caudal (RC) axis in primates (varying by a factor of 1.64-2.13 across the rostral and caudal poles) but less in rodents (varying by a factor of 1.15-1.54). Layer II-IV neurons account for most of this variation. When integrated into the context of species variation, and this RC gradient in neuron numbers, conflicts between studies can be accounted for. The RC variation in isocortical neurons in adulthood mirrors the gradients in neurogenesis duration in development.

Keywords: cortex; development; gradient; numbers.


Figures

Figure 1.
Figure 1.
We used the optical fractionator method to estimate neuron numbers in layers II–IV and V–VI in Nissl stained sections under a unit of cortical surface area in 3 rodent and 3 primate species. We systematically sampled sites along the rostro-caudal and medio-lateral axis of the isocortex. (A) A coronal section of a hamster Nissl-stained coronal section. The total surface area of the isocortex of the hamster was measured in each serial section and sites were systematically sampled along 20%, 40%, 60%, and 80% of the medio-lateral axis of the isocortical surface. (B) Evenly spaced sampled sites were selected orthogonal to the cortical surface area. (C) We reconstructed 3D digital models of the isocortex to correct for variations in the curvature of the isocortical surface. The 3D reconstruction of the hamster isocortex is shown here. Scale bar: 1 mm.
Figure 2.
Figure 2.
(A) Total unilateral isocortical neuron numbers plotted against brain size in primates and in rodents. (B) Total unilateral isocortical neuron numbers plotted against cortex volume in primates and in rodents. For a given brain size or isocortex size, rodents exhibit fewer isocortical neurons than primates.
Figure 3.
Figure 3.
Unilateral supragranular layer neuron numbers increase with a slope >1 in primates and in rodents when regressed against unilateral infragranular layer neurons. Thus, supragranular layer neurons increase faster in numbers than infragranular layer neurons as overall isocortical populations expand across species.
Figure 4.
Figure 4.
Total isocortical neurons and isocortical surface area are shown on the left. Total neuron numbers as well as supragranular (layer II–IV) and infragranular (layer V–VI) neuron numbers per mm2 of cortical surface in the capuchin, owl monkey, tamarin, paca, agouti, and hamster are plotted against the (RC) rostro-caudal axis and (ML) medio-lateral axes of the isocortical sheet. The rostro-caudal and medio-lateral axes are displayed in millimeters. Data points from primary visual cortex (V1) of primates are shown in red.
Figure 5.
Figure 5.
Total neuron numbers per mm2 of cortical surface area in primate and rodent species are shown on a single graph. Primates exhibit a steeper slope in neuron numbers per mm2 of cortical surface area when regressed against the (RC) rostro-caudal and (ML) medio-lateral axes of the isocortical sheet compared with rodents. The RC and ML axes are in millimeters. The plotted surfaces are shifted on the rostro-caudal axis for better visibility.
Figure 6.
Figure 6.
(A) Neuron numbers (in supragranular and infragranular layers) per mm2 of cortical surface area in the rostral and caudal poles of the isocortex. Species are ordered by total number of isocortical neurons. Species with more isocortical neurons exhibit a greater range of variation in neuron numbers under 1 mm2 of cortical surface between the rostral and caudal poles. The range of variation in infragranular layer neurons is relatively small in primates and in rodents. The error bars indicate the standard errors for the respective layers (not for the total number of neurons in the column) (B) Density of neurons at the rostral and caudal poles in supra- (plotted on top) and infragranular layers (plotted at bottom). The range of variation in neuron numbers is similar to the range of variation in neuron density between the rostral and caudal poles across species. (C) A visualization of the implied height of the cortical columns, within the layers of which the stipple density is proportional to neuronal density, shows a rostro-caudal decrease in column height.
Figure 7.
Figure 7.
Estimates of V1 neuron numbers assessed with the use of the optical disector and the istroptic fractionator methods plotted against V1 volume. The estimates obtained from the optical disector method are much higher than that estimated with the isotropic fractionator method. Data from Christensen et al. (2007) show 1 standard deviation for the estimated V1 volume and estimated V1 neuron numbers. Shown here are values for one hemisphere.
Figure 8.
Figure 8.
Unilateral cerebral cortical neuron numbers estimated with the use of the isotropic fractionator method are plotted against cerebral cortex volume and isocortical neuron numbers from the present analysis are plotted against isocortical volume. Estimates obtained with the isotropic fractionator method includes the isocortex (depicted in black in the agouti and paca) a number of limbic structures (depicted in dark grey), which are known to differ in size between these 2 taxonomic groups (Reep et al. 2007; this study). Data on primates are from Herculano-Houzel et al. (2007) and Gabi et al. (2010). Data on rodents are from Herculano-Houzel et al. (2011). Cerebral cortex volume was estimated by dividing the weight by 1.036 to reconstruct volume.

References

    1. Abercrombie M. Estimation of nuclear populations from microtome sections. Anat Rec. 1946;94:239–247. - PubMed
    1. Bayer SA, Altman J. Development of layer I and the subplate in the rat neocortex. Exp Neurol. 1990;107:48–62. - PubMed
    1. Bayer SA, Altman J. Neocortical development. New York: Raven; 1991.
    1. Beaulieu C, Colonnier M. Number and size of neurons and synapses in the motor cortex of cats raised in different environmental complexities. J Comp Neurol. 1989;289:178–187. - PubMed
    1. Benes FM, Lange N. Two-dimensional versus three-dimensional cell counting: a practical perspective. Trends Neurosci. 2001;24:11–17. - PubMed

Publication types