. 2013 Sep 15;191(6):2967-77.
doi: 10.4049/jimmunol.1300419. Epub 2013 Aug 19.

The interdependent, overlapping, and differential roles of type I and II IFNs in the pathogenesis of experimental autoimmune encephalomyelitis

Affiliations

The interdependent, overlapping, and differential roles of type I and II IFNs in the pathogenesis of experimental autoimmune encephalomyelitis

Rodrigo Naves et al. J Immunol. .

Abstract

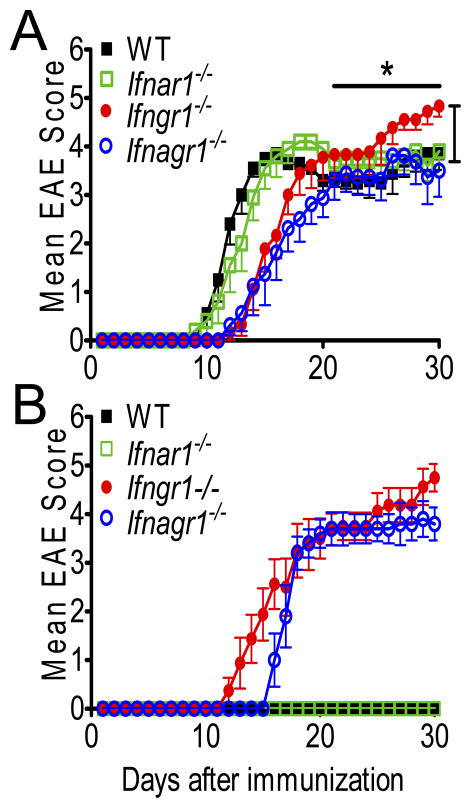
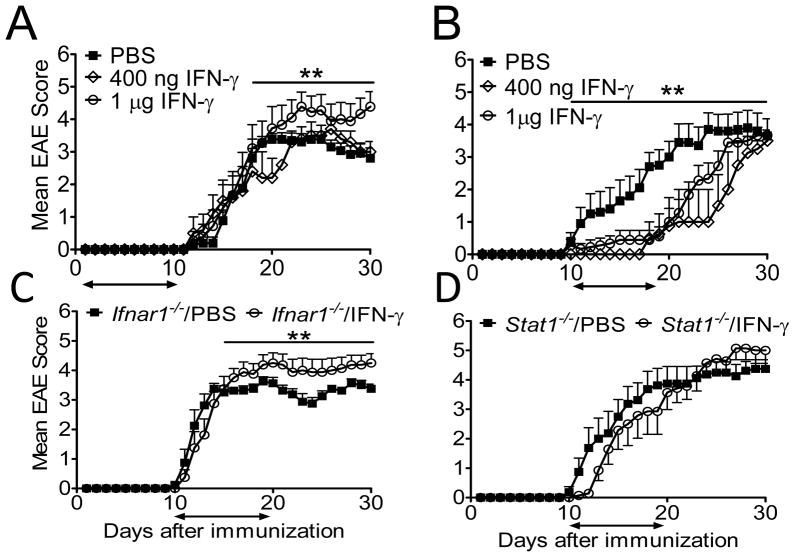
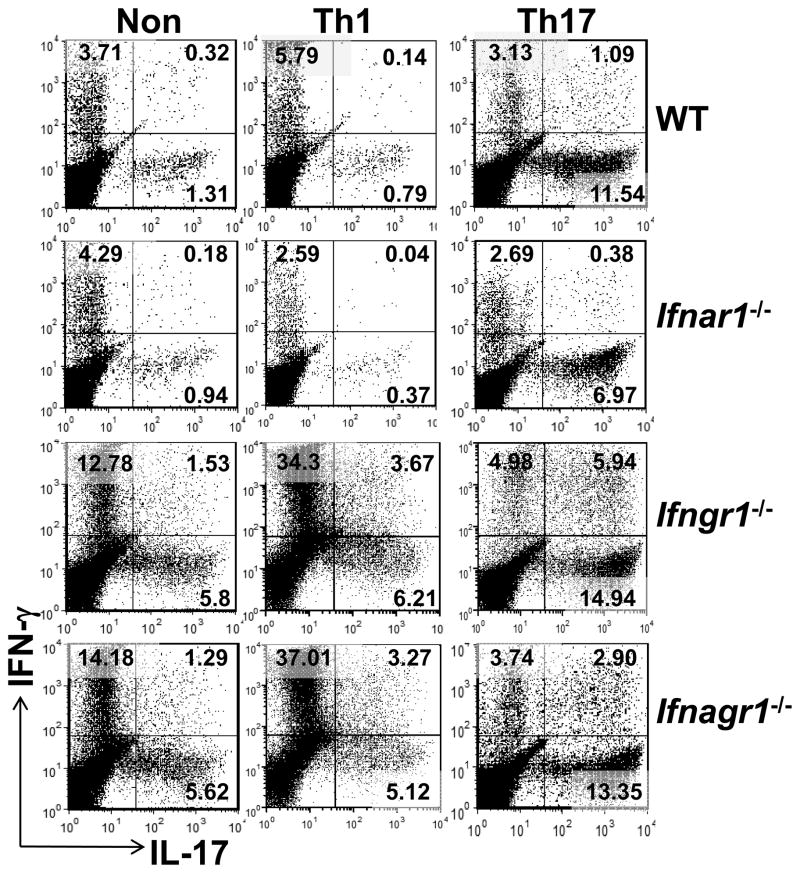
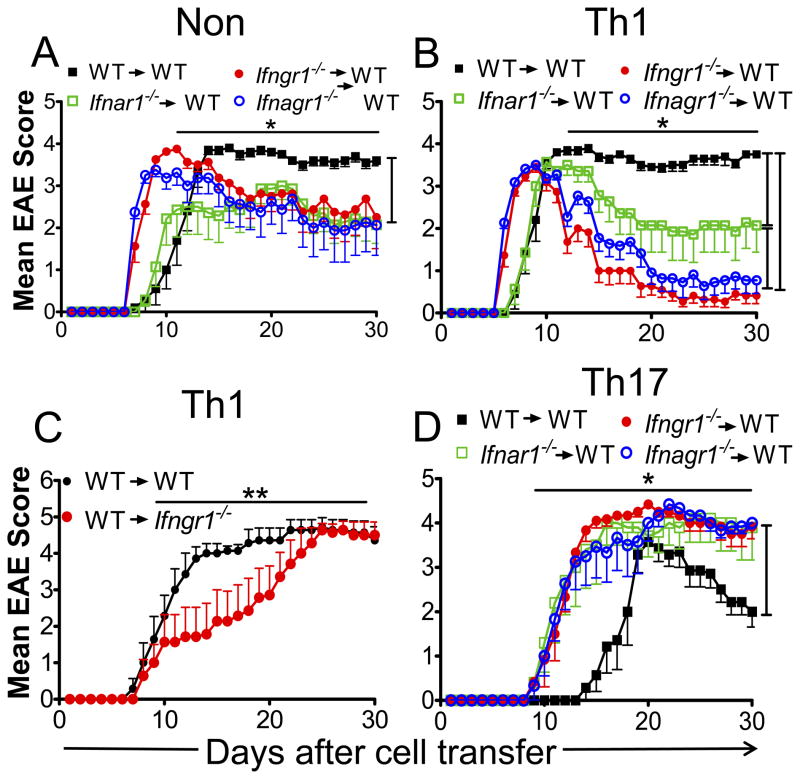
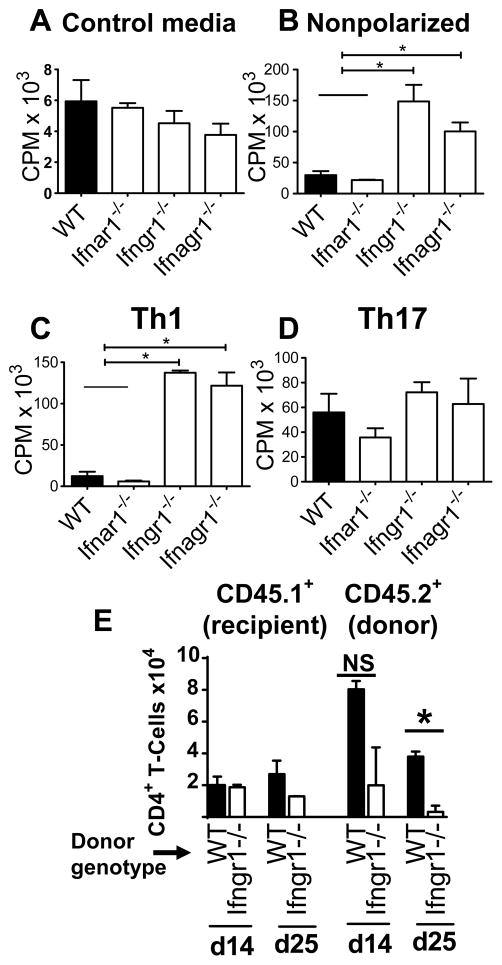
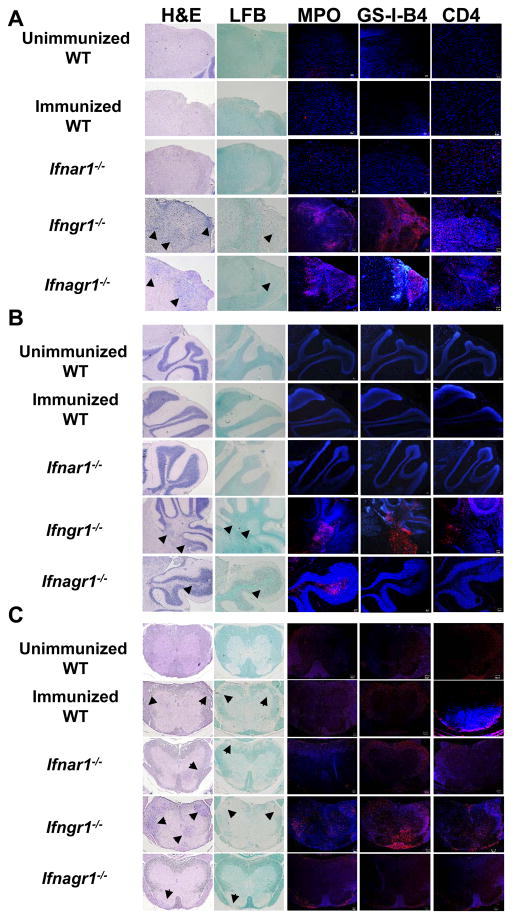
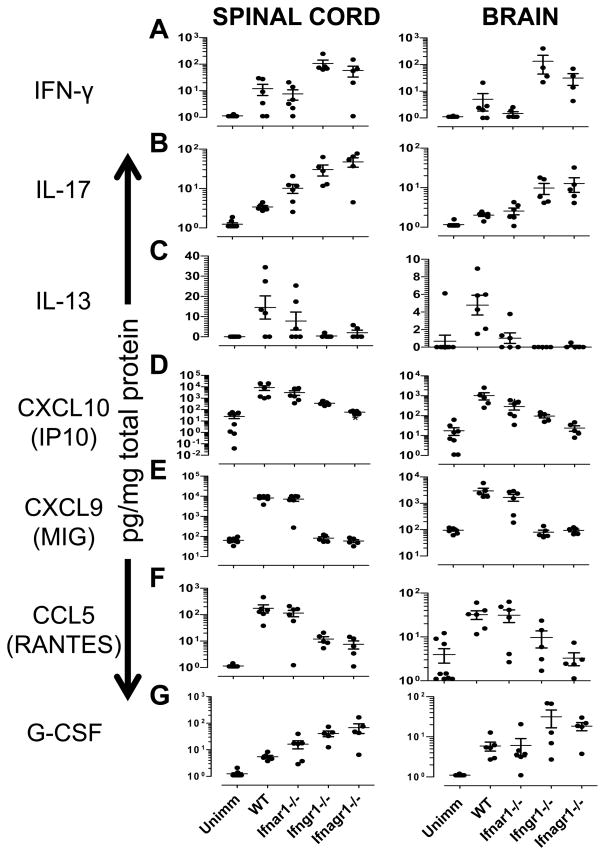
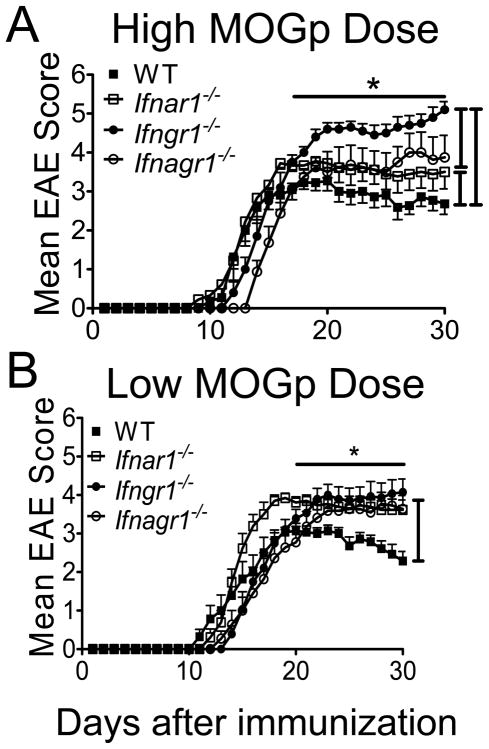
Type I IFNs (IFN-α and IFN-β) and type II IFN (IFN-γ) mediate both regulation and inflammation in multiple sclerosis, neuromyelitis optica, and in experimental autoimmune encephalomyelitis (EAE). However, the underlying mechanism for these Janus-like activities of type I and II IFNs in neuroinflammation remains unclear. Although endogenous type I IFN signaling provides a protective response in neuroinflammation, we find that when IFN-γ signaling is ablated, type I IFNs drive inflammation, resulting in exacerbated EAE. IFN-γ has a disease stage-specific opposing function in EAE. Treatment of mice with IFN-γ during the initiation phase of EAE leads to enhanced severity of disease. In contrast, IFN-γ treatment during the effector phase attenuated disease. This immunosuppressive activity of IFN-γ required functional type I IFN signaling. In IFN-α/β receptor-deficient mice, IFN-γ treatment during effector phase of EAE exacerbated disease. Using an adoptive transfer EAE model, we found that T cell-intrinsic type I and II IFN signals are simultaneously required to establish chronic EAE by encephalitogenic Th1 cells. However, in Th17 cells loss of either IFN signals leads to the development of a severe chronic disease. The data imply that type I and II IFN signals have independent but nonredundant roles in restraining encephalitogenic Th17 cells in vivo. Collectively, our data show that type I and II IFNs function in an integrated manner to regulate pathogenesis in EAE.


Figures

FIGURE 1
FIGURE 1
Type I and II IFN signaling determine severity of disease. (A) Classical and (B) atypical clinical scores from WT, Ifnar1−/−, Ifngr1−/− and Ifnagr1−/−mice induced with 150 μg of MOGp per mouse. Error bars represent means ± s.e.m., n=8–14 mice per group. Results are pooled from three experiments. *P < 0.05 for comparison between Ifngr1−/− vs WT, Ifnar1−/−and Ifnagr1−/− mice between days 21–30 and for Ifnagr1−/− vs WT, Ifnar1−/−mice and Ifngr1−/− mice between days 1–30.
FIGURE 2
FIGURE 2
Dual role of IFN-γ in EAE. Clinical scores from EAE in C57BL/6 mice that were treated with PBS, 400 ng or 1 μg IFN-γ daily from (A) day 1 to day 10 or (B) day 10 to day 19 after EAE induction. n=9–13 mice/group. (C) Clinical scores from EAE in WT and Ifnar1−/− mice that were treated with PBS or 1 μg IFN-γ daily from day 10 to day 19 after EAE-induction. n=8 mice/group. (D) Clinical scores from EAE in WT and Stat1−/− mice treated with PBS or 1 μg IFN-γ daily from day 10 to day 19 after EAE-induction. n=7–12 mice/group. Results are pooled from two or three experiments. **P < 0.001 for comparisons between (A) 1 μg IFN-γ-treated WT mice versus PBS-treated WT and 400 ng IFN-γ-treated WT between days 16–30; (B) PBS-treated WT versus 400 ng and 1 μg IFN-γ-treated WT mice between days 10–30; (C) PBS-treated Ifnar1−/− mice versus IFN-γ-treated Ifnar1−/− between days 16–30.
FIGURE 3
FIGURE 3
Encephalitogenic Th1 and Th17 cell differentiation in the presence or absence of IFN receptors. Percentage of IFN-γ+CD4+ and IL-17+CD4+ T-cells in mononuclear cells isolated from pooled spleen and lymph nodes (5 mice per group) of WT, Ifnar1−/−, Ifngr1−/− and Ifnagr1−/−mice 11 days after EAE induction. Cells were re-stimulated in vitro with MOG35–55 peptide in nonpolarizing (Non), Th1-polarizing (Th1) or Th17-polarizing (Th17) conditions. After 72 hours, intracellular cytokine production was determined by flow cytometry. The data shown are representative of four independent experiments.
FIGURE 4
FIGURE 4
Type I and II IFN signals are required to sustain Th1 EAE but not Th17 EAE. (A, B and D) Clinical scores of WT mice with EAE induced by adoptive transfer of (A) nonpolarized cells (NON), (B) Th1 cells or (D) Th17 cells isolated from MOGp-induced WT, Ifnar1−/−, Ifngr1−/− or Ifnagr1−/− mice. (C) Clinical scores of EAE in WT or Ifngr1−/− mice induced by adoptive transfer of WT Th1 cells. Error bars represent means ± SEM (n= 7–11 mice/group). Results are pooled from three experiments. *P < 0.05: (A) WT versus Ifnar1−/−, Ifngr1−/− and Ifnagr1−/− mice between days 11–30; (B) WT versus Ifnar1−/−, Ifngr1−/− and Ifnagr1−/− mice between days 12–30 and Ifnar1−/− mice vs Ifngr1−/− and Ifnagr1−/− mice between days 12–30; (D) WT versus Ifnar1−/−, Ifngr1−/− and Ifnagr1−/− mice between days 10–30. **P < 0.001.
FIGURE 5
FIGURE 5
IFNGR deficient encephalitogenic Th1 cells but not Th17 cells hyperproliferate but don’t persist in vivo. [3H]-Thy-cell proliferation of donor cells re-stimulated in vitro in (A) absence (control media) or (B–D) presence of 10 μg/ml MOGp in (B) nonpolarizing (Non), (C) Th1-polarizing (Th1) or (D) Th17-polarizing (Th17) conditions. Results are expressed in counts per minute (CPM). Error bars represent mean ± SEM values from three independent experiments. * P < 0.05. (E) IFNGR1-deficient Th1 polarized encephalitogenic T-cells do not persist. CD45.2 WT or Ifngr1−/− Th1 polarized encephalitogenic cells were transferred into naïve WT CD45.1 recipients. On days 14 and 25 post transfer, the number of infiltrating recipient (CD45.1+) CD4+ T-cells or donor (CD45.2+) CD4+ T-cells was determined by flow cytometry. Cell number±SD at each time point represents mean from two pools of three mice each.
FIGURE 6
FIGURE 6
IFN-γ signaling determines the distribution of CNS cell-infiltration independent of type I IFN signaling. Histology of (A) brain stem, (B) cerebellum and(C) SC sections from uninduced wild type (WT) mice and EAE-induced wild type (WT), Ifnar1−/−, Ifngr1−/−and Ifnagr1−/− mice after 20 days of induction. Tissue sections were stained to evaluate cell infiltration (H&E), demyelination (luxol fast blue, LFB), neutrophil infiltration (myeloperoxidase, MPO), microglia/macrophages activation (GS-l-B4) and CD4+ T-cells infiltration. Arrows mark areas of cell infiltration or demyelination. Representative sections from two serial sections per mouse from two mice per group are shown.
FIGURE 7
FIGURE 7. Cytokine and chemokine expression in the CNS of mice lacking type I and/or type II IFN receptors
Expression of (A) IFN-γ (B) IL-17, (C) IL-13 (D) CXCL10 (IP10), (E) CXCL9 (F) CCL5 (RANTES), and (G) G-CSF in spinal cord and brain isolated from unimmunized (unimm, n=9) and EAE-induced wild type (WT, n=6), Ifnar1−/− (n=5), Ifngr1−/− (n=5) and Ifnagr1−/− (n=5) mice at day 20 after EAE induction. Data represent means ± SEM of cytokine/chemokine concentration expressed as pg/mg total protein. The statistical comparisons are presented in Table S1.
FIGURE 8
FIGURE 8
Type I and II IFN signaling determine severity of disease and the threshold for EAE susceptibility. Classical clinical scores from WT, Ifnar1−/−, Ifngr1−/− and Ifnagr1−/− mice induced with (A) 300 μg (high dose) or (B) 50 μg (low dose) of MOGp per mouse. Error bars represent mean ± SEM, n=8–14 mice/group. Results are pooled from three similar experiments. *P < 0.05 for groups of mice compared in the figure between days (A) 17–30 and (B) 20–30.

References

    1. Borden EC, Sen GC, Uze G, Silverman RH, Ransohoff RM, Foster GR, Stark GR. Interferons at age 50: past, current and future impact on biomedicine. Nature reviews Drug discovery. 2007;6:975–990. - PMC - PubMed
    1. Farrar MA, Schreiber RD. The molecular cell biology of interferon-gamma and its receptor. Annu Rev Immunol. 1993;11:571–611. - PubMed
    1. Theofilopoulos AN, Baccala R, Beutler B, Kono DH. Type I interferons (alpha/beta) in immunity and autoimmunity. Annu Rev Immunol. 2005;23:307–336. - PubMed
    1. Pace JL. Synergistic interactions between IFN-gamma and IFN-beta in priming murine macrophages for tumor cell killing. J Leukoc Biol. 1988;44:514–520. - PubMed
    1. Dezfouli S, Hatzinisiriou I, Ralph SJ. Enhancing CTL responses to melanoma cell vaccines in vivo: synergistic increases obtained using IFNgamma primed and IFNbeta treated B7–1+ B16-F10 melanoma cells. Immunology and cell biology. 2003;81:459–471. - PubMed

Publication types

MeSH terms

LinkOut - more resources