. 2012 Oct 24:1:41.
doi: 10.1186/2193-1801-1-41. eCollection 2012.

An approach to predict the risk of glaucoma development by integrating different attribute data

Affiliations

An approach to predict the risk of glaucoma development by integrating different attribute data

Yuichi Tokuda et al. Springerplus. .

Abstract

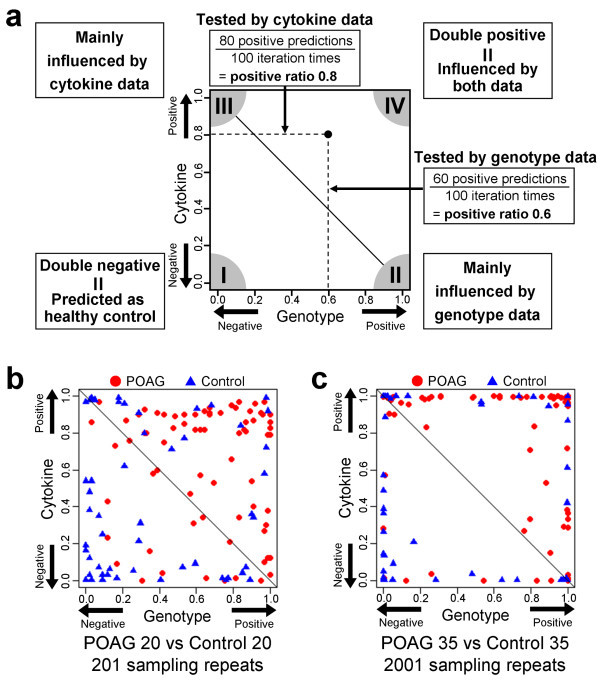
Primary open-angle glaucoma (POAG) is one of the major causes of blindness worldwide and considered to be influenced by inherited and environmental factors. Recently, we demonstrated a genome-wide association study for the susceptibility to POAG by comparing patients and controls. In addition, the serum cytokine levels, which are affected by environmental and postnatal factors, could be also obtained in patients as well as in controls, simultaneously. Here, in order to predict the effective diagnosis of POAG, we developed an "integration approach" using different attribute data which were integrated simply with several machine learning methods and random sampling. Two data sets were prepared for this study. The one is the "training data set", which consisted of 42 POAG and 42 controls. The other is the "test data set" consisted of 73 POAG and 52 controls. We first examined for genotype and cytokine data using the training data set with general machine learning methods. After the integration approach was applied, we obtained the stable accuracy, using the support vector machine method with the radial basis function. Although our approach was based on well-known machine learning methods and a simple process, we demonstrated that the integration with two kinds of attributes, genotype and cytokines, was effective and helpful in diagnostic prediction of POAG.

Keywords: GWAS; Glaucoma; Integration approach; Machine learning.


Figures

Figure 1
Figure 1
Scatter plot showing the ratio of POAG prediction for each sample. Figure 1 (a) The example figure for the scatter plot. The horizontal axis represents the ratio of positive prediction using genotype data. The positive prediction indicated the sample with POAG feature, and the negative prediction indicated the sample with control feature. The ratio was obtained by dividing the number of positive predictions by the total test number. Thus, “1” and “0” indicate 100% prediction as positive and negative, respectively. The vertical axis similarly represents the ratio using the cytokine data. Dots and triangles represent POAG and control samples, respectively. The figure can be read as, if one POAG sample was predicted as positive 60 times using the genotype data and 80 times using the cytokine data each with 100 sampling repeat times, the sample is plotted at (0.6, 0.8) by dot. If the approach has a good performance (means; highly negative or positive prediction) for samples with interaction between those two attributes, more samples will be plotted in the corner I or corner IV. If either the genotype or cytokine data is at risk for POAG, such samples will be plotted in the corner II or corner III, respectively. The diagonal line shows the threshold of the prediction by the integration approach. If a sample is plotted above or below the threshold, the final prediction result is positive or negative, respectively. Figure 1 (b) shows one of the examples as the comparatively smaller and unstable, which is the result with 40 sampling size and 201sampling times by RBF SVM method. Figure 1 (c), one of the examples as the best stable result, which is the result with 70 sampling size and 2,001sampling times by RBF SVM method.

References

    1. Balding DJ. A tutorial on statistical methods for population association studies. Nat Rev Genet. 2006;7(10):781–791. doi: 10.1038/nrg1916. - DOI - PubMed
    1. Ban HJ, Heo JY, Oh KS, Park KJ. Identification of type 2 diabetes-associated combination of SNPs using support vector machine. BMC Genet. 2010;11:26. doi: 10.1186/1471-2156-11-26. - DOI - PMC - PubMed
    1. Barrett JC, Fry B, Maller J, Daly MJ. Haploview: analysis and visualization of LD and haplotype maps. Bioinformatics. 2005;21(2):263–265. doi: 10.1093/bioinformatics/bth457. - DOI - PubMed
    1. Breiman L. Bagging Predictors. Mach Learn. 1996;24(2):123–140.
    1. Burdon KP, Macgregor S, Hewitt AW, Sharma S, Chidlow G, Mills RA, Danoy P, Casson R, Viswanathan AC, Liu JZ, Landers J, Henders AK, Wood J, Souzeau E, Crawford A, Leo P, Wang JJ, Rochtchina E, Nyholt DR, Martin NG, Montgomery GW, Mitchell P, Brown MA, Mackey DA, Craig JE. Genome-wide association study identifies susceptibility loci for open angle glaucoma at TMCO1 and CDKN2B-AS1. Nat Genet. 2011;43(6):574–578. doi: 10.1038/ng.824. - DOI - PubMed

LinkOut - more resources