

Hip structural analysis: a comparison of DXA with CT in postmenopausal Japanese women
- PMID: 23961402
- PMCID: PMC3724983
- DOI: 10.1186/2193-1801-2-331
Hip structural analysis: a comparison of DXA with CT in postmenopausal Japanese women
Abstract
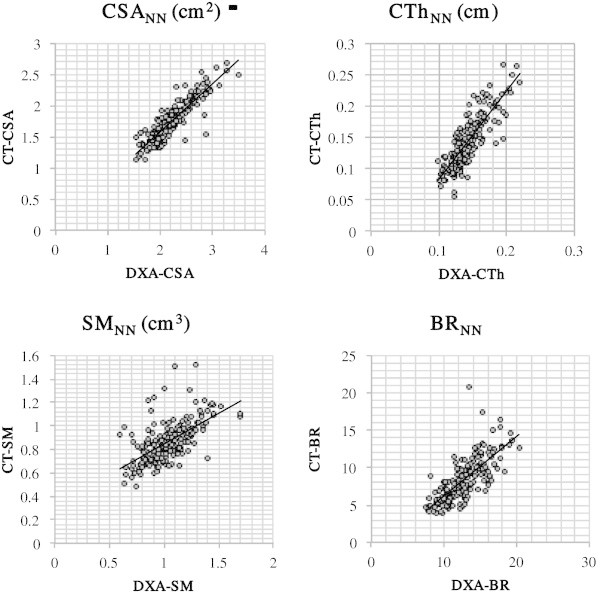
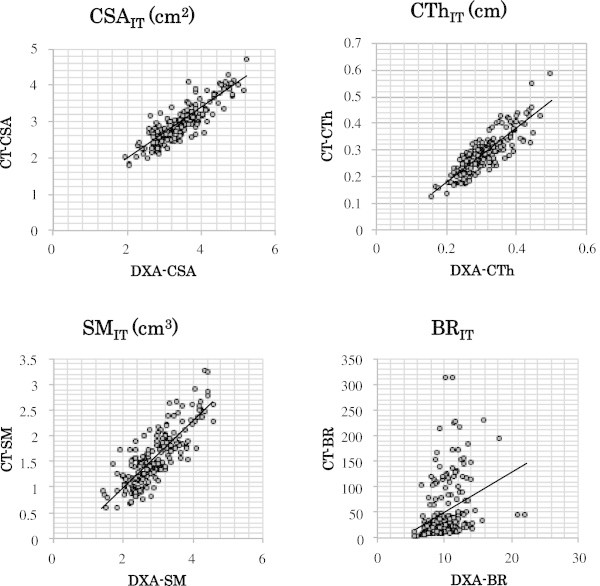
Geometry of the proximal femur is one determinant of fracture risk, and can be analyzed by a simple method using dual-energy X-ray absorptiometry (DXA). The aim of the present study was to investigate the accuracy of hip structural analysis (HSA) using clinical data in postmenopausal Japanese women. A total of 184 postmenopausal women aged 51-88 years (mean, 70.5 ± 8.7 years) who underwent artificial joint replacement surgery for osteoarthrosis of the hip or knee joint were included. Computed tomography (CT) data from preoperative assessment were utilized for analysis of proximal femoral geometry (CT-HSA) using QCTPro Software (Mindways Software Inc., Austin, TX) and compared with HSA results based on DXA (DXA-HSA). The results of femoral geometry were further compared with a CT-based finite-element method (CT/FEM). There was moderate to high correlation between DXA-HSA and CT-HSA (r=0.60-0.90, p<0.001), except for the buckling ratio in the intertrochanteric region. Moreover, the correlation of HSA with CT/FEM was similar between DXA-HSA and CT-HSA. The present results suggest that the geometry of proximal femoral cross sections can be reasonably well characterized using DXA.
Keywords: Bone strength; CT-based finite-element method; Hip structural analysis; QCT.
Figures
References
-
- Bauer JS, Kohlmann S, Eckstein F, Mueller D, Lochmüller EM, Link TM. Structural analysis of trabecular bone of the proximal femur using multislice computed tomography: a comparison with dual X-ray absorptiometry for predicting biomechanical strength in vitro. Calcif Tissue Int. 2006;78:78–89. doi: 10.1007/s00223-005-0070-3. - DOI - PubMed
LinkOut - more resources
Full Text Sources
Other Literature Sources
