

Global expression profiling reveals genetic programs underlying the developmental divergence between mouse and human embryogenesis
- PMID: 23961710
- PMCID: PMC3924405
- DOI: 10.1186/1471-2164-14-568
Global expression profiling reveals genetic programs underlying the developmental divergence between mouse and human embryogenesis
Abstract
Background: Mouse has served as an excellent model for studying human development and diseases due to its similarity to human. Advances in transgenic and knockout studies in mouse have dramatically strengthened the use of this model and significantly improved our understanding of gene function during development in the past few decades. More recently, global gene expression analyses have revealed novel features in early embryogenesis up to gastrulation stages and have indeed provided molecular evidence supporting the conservation in early development in human and mouse. On the other hand, little information is known about the gene regulatory networks governing the subsequent organogenesis. Importantly, mouse and human development diverges during organogenesis. For instance, the mouse embryo is born around the end of organogenesis while in human the subsequent fetal period of ongoing growth and maturation of most organs spans more than 2/3 of human embryogenesis. While two recent studies reported the gene expression profiles during human organogenesis, no global gene expression analysis had been done for mouse organogenesis.
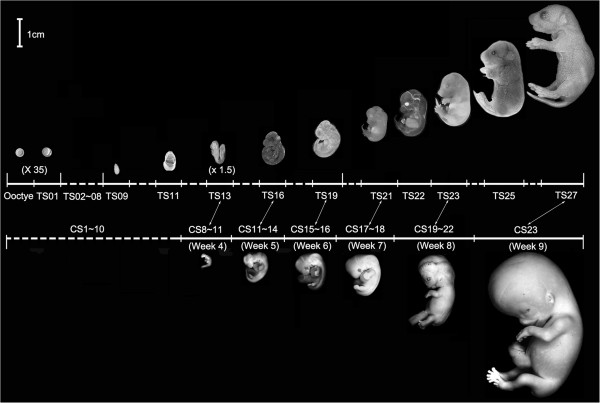
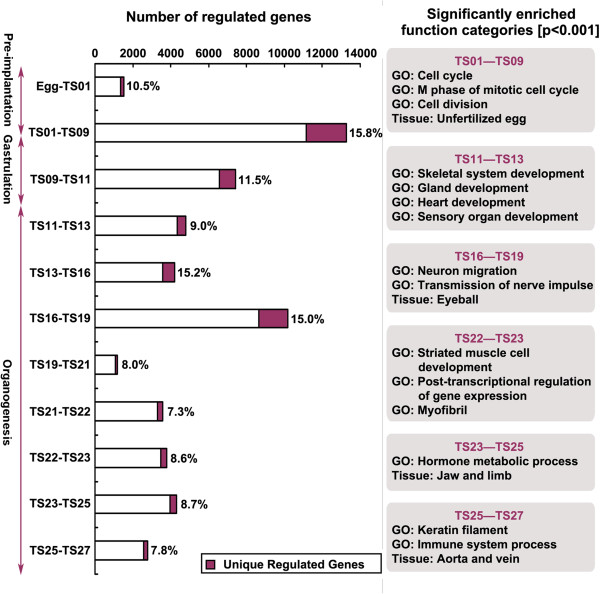
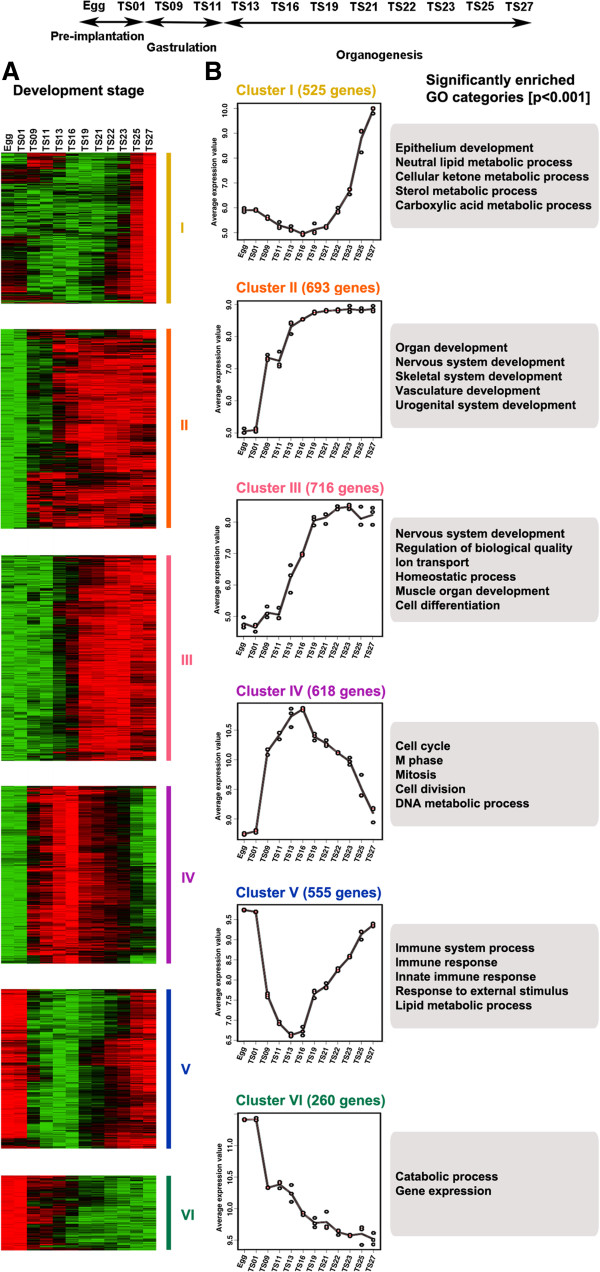
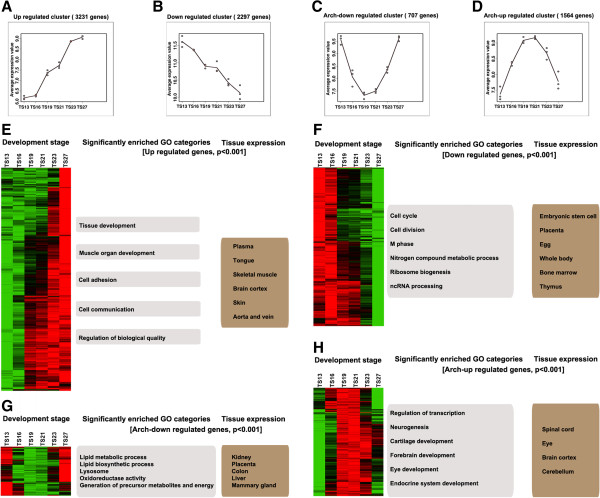
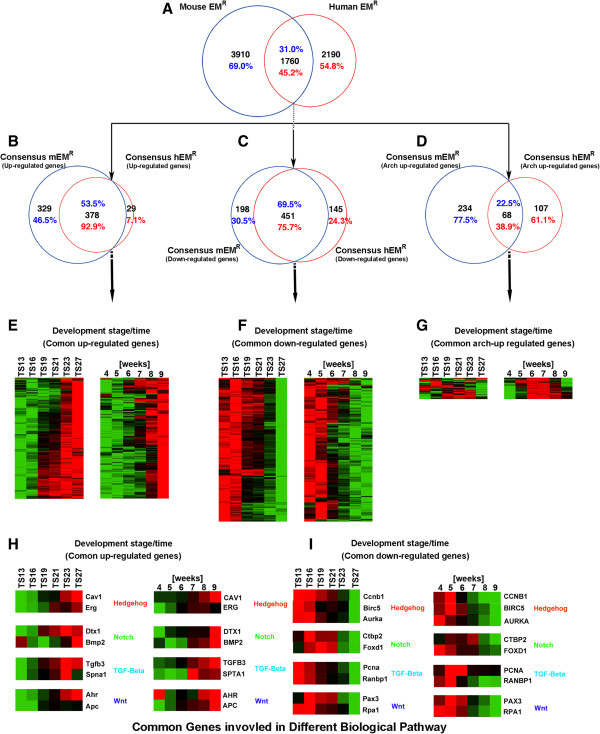
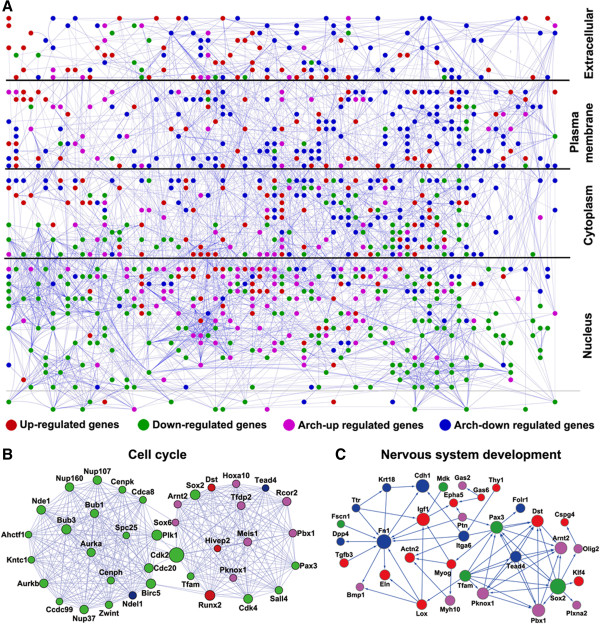
Results: Here we report a detailed analysis of the global gene expression profiles from egg to the end of organogenesis in mouse. Our studies have revealed distinct temporal regulation patterns for genes belonging to different functional (Gene Ontology or GO) categories that support their roles during organogenesis. More importantly, comparative analyses identify both conserved and divergent gene regulation programs in mouse and human organogenesis, with the latter likely responsible for the developmental divergence between the two species, and further suggest a novel developmental strategy during vertebrate evolution.
Conclusions: We have reported here the first genome-wide gene expression analysis of the entire mouse embryogenesis and compared the transcriptome atlas during mouse and human embryogenesis. Given our earlier observation that genes function in a given process tends to be developmentally co-regulated during organogenesis, our microarray data here should help to identify genes associated with mouse development and/or infer the developmental functions of unknown genes. In addition, our study might be useful for invesgtigating the molecular basis of vertebrate evolution.
Figures
Similar articles
-
Global gene expression during the human organogenesis: from transcription profiles to function predictions.Int J Biol Sci. 2011;7(7):1068-76. doi: 10.7150/ijbs.7.1068. Epub 2011 Sep 7. Int J Biol Sci. 2011. PMID: 21927576 Free PMC article. Review.
-
RNA-seq based transcriptomic map reveals new insights into mouse salivary gland development and maturation.BMC Genomics. 2016 Nov 16;17(1):923. doi: 10.1186/s12864-016-3228-7. BMC Genomics. 2016. PMID: 27852218 Free PMC article.
-
De Novo Transcriptome Sequencing Analysis of Goose (Anser anser) Embryonic Skin and the Identification of Genes Related to Feather Follicle Morphogenesis at Three Stages of Development.Int J Mol Sci. 2018 Oct 15;19(10):3170. doi: 10.3390/ijms19103170. Int J Mol Sci. 2018. PMID: 30326614 Free PMC article.
-
Studies on Xenopus laevis intestine reveal biological pathways underlying vertebrate gut adaptation from embryo to adult.Genome Biol. 2010;11(5):R55. doi: 10.1186/gb-2010-11-5-r55. Epub 2010 May 19. Genome Biol. 2010. PMID: 20482879 Free PMC article.
-
The genome-wide molecular regulation of mouse gastrulation embryo.Sci China Life Sci. 2017 Apr;60(4):363-369. doi: 10.1007/s11427-016-0285-3. Epub 2017 Feb 27. Sci China Life Sci. 2017. PMID: 28251461 Review.
Cited by
-
N-α-acetyltransferase 10 (NAA10) in development: the role of NAA10.Exp Mol Med. 2018 Jul 27;50(7):1-11. doi: 10.1038/s12276-018-0105-2. Exp Mol Med. 2018. PMID: 30054454 Free PMC article. Review.
-
Epigenetic Reprogramming in Mice and Humans: From Fertilization to Primordial Germ Cell Development.Cells. 2023 Jul 17;12(14):1874. doi: 10.3390/cells12141874. Cells. 2023. PMID: 37508536 Free PMC article. Review.
-
Epigenetic regulation in development: is the mouse a good model for the human?Hum Reprod Update. 2018 Sep 1;24(5):556-576. doi: 10.1093/humupd/dmy021. Hum Reprod Update. 2018. PMID: 29992283 Free PMC article. Review.
-
Artificial Uterus and Artificial Embryos: Unsolved Tasks.Reprod Sci. 2025 Aug 27. doi: 10.1007/s43032-025-01939-y. Online ahead of print. Reprod Sci. 2025. PMID: 40866778 Review.
-
Effect of Carbon Black Nanoparticle on Neonatal Lymphoid Tissues Depending on the Gestational Period of Exposure in Mice.Front Toxicol. 2021 Aug 11;3:700392. doi: 10.3389/ftox.2021.700392. eCollection 2021. Front Toxicol. 2021. PMID: 35295157 Free PMC article.
References
-
- Church DM, Goodstadt L, Hillier LW, Zody MC, Goldstein S, She X, Bult CJ, Agarwala R, Cherry JL, DiCuccio M, Hlavina W, Kapustin Y, Meric P, Maglott D, Birtle Z, Marques AC, Graves T, Zhou S, Teague B, Potamousis K, Churas C, Place M, Herschleb J, Runnheim R, Forrest D, Amos-Landgraf J, Schwartz DC, Cheng Z, Lindblad-Toh K, Eichler EE. et al.Lineage-specific biology revealed by a finished genome assembly of the mouse. PLoS Biol. 2009;14(5):e1000112. doi: 10.1371/journal.pbio.1000112. - DOI - PMC - PubMed
Publication types
MeSH terms
Associated data
- Actions
Grants and funding
LinkOut - more resources
Full Text Sources
Other Literature Sources
Molecular Biology Databases
Miscellaneous
