

Use of electron paramagnetic resonance to solve biochemical problems
- PMID: 23961941
- PMCID: PMC3839053
- DOI: 10.1021/bi400834a
Use of electron paramagnetic resonance to solve biochemical problems
Abstract
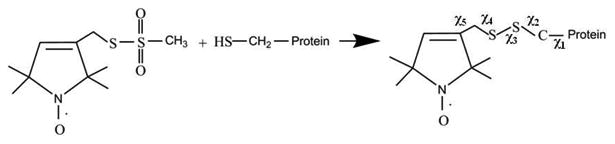
Electron paramagnetic resonance (EPR) spectroscopy is a very powerful biophysical tool that can provide valuable structural and dynamic information about a wide variety of biological systems. The intent of this review is to provide a general overview for biochemists and biological researchers of the most commonly used EPR methods and how these techniques can be used to answer important biological questions. The topics discussed could easily fill one or more textbooks; thus, we present a brief background on several important biological EPR techniques and an overview of several interesting studies that have successfully used EPR to solve pertinent biological problems. The review consists of the following sections: an introduction to EPR techniques, spin-labeling methods, and studies of naturally occurring organic radicals and EPR active transition metal systems that are presented as a series of case studies in which EPR spectroscopy has been used to greatly further our understanding of several important biological systems.
Figures


Similar articles
-
Combining high-field EPR with site-directed spin labeling reveals unique information on proteins in action.Magn Reson Chem. 2005 Nov;43 Spec no.:S4-S19. doi: 10.1002/mrc.1690. Magn Reson Chem. 2005. PMID: 16235212
-
Site-directed spin labeling EPR spectroscopy in protein research.Biol Chem. 2013 Oct;394(10):1281-300. doi: 10.1515/hsz-2013-0155. Biol Chem. 2013. PMID: 23912220 Review.
-
Nitroxide spin labels and EPR spectroscopy: A powerful association for protein dynamics studies.Biochim Biophys Acta Proteins Proteom. 2021 Jul;1869(7):140653. doi: 10.1016/j.bbapap.2021.140653. Epub 2021 Mar 20. Biochim Biophys Acta Proteins Proteom. 2021. PMID: 33757896 Review.
-
Elucidating the design principles of photosynthetic electron-transfer proteins by site-directed spin labeling EPR spectroscopy.Biochim Biophys Acta. 2016 May;1857(5):548-556. doi: 10.1016/j.bbabio.2015.08.009. Epub 2015 Sep 1. Biochim Biophys Acta. 2016. PMID: 26334844 Review.
-
Distance measurements by continuous wave EPR spectroscopy to monitor protein folding.Methods Mol Biol. 2011;752:73-96. doi: 10.1007/978-1-60327-223-0_6. Methods Mol Biol. 2011. PMID: 21713632
Cited by
-
Physical Methods for Seed Invigoration: Advantages and Challenges in Seed Technology.Front Plant Sci. 2016 May 12;7:646. doi: 10.3389/fpls.2016.00646. eCollection 2016. Front Plant Sci. 2016. PMID: 27242847 Free PMC article. Review.
-
Structural Dynamics and Topology of the Inactive Form of S21 Holin in a Lipid Bilayer Using Continuous-Wave Electron Paramagnetic Resonance Spectroscopy.J Phys Chem B. 2020 Jul 2;124(26):5370-5379. doi: 10.1021/acs.jpcb.0c03575. Epub 2020 Jun 19. J Phys Chem B. 2020. PMID: 32501696 Free PMC article.
-
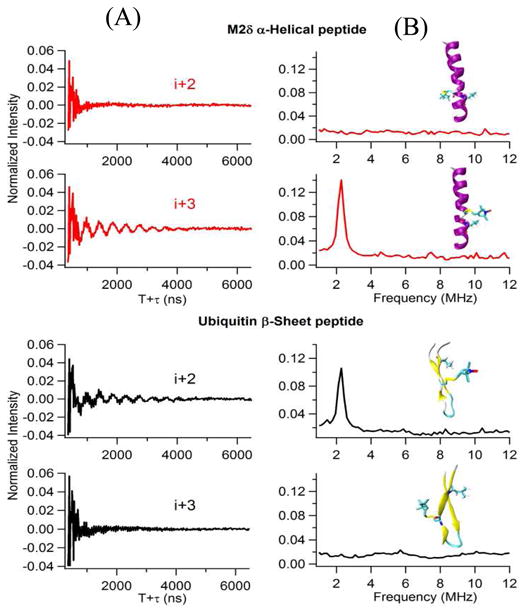
Determining the Secondary Structure of Membrane Proteins and Peptides Via Electron Spin Echo Envelope Modulation (ESEEM) Spectroscopy.Methods Enzymol. 2015;564:289-313. doi: 10.1016/bs.mie.2015.06.037. Epub 2015 Aug 1. Methods Enzymol. 2015. PMID: 26477255 Free PMC article.
-
Recent Advances in In-Vitro Assays for Type 2 Diabetes Mellitus: An Overview.Rev Diabet Stud. 2020;16(1):13-23. doi: 10.1900/RDS.2020.16.13. Epub 2020 Dec 28. Rev Diabet Stud. 2020. PMID: 33905469 Free PMC article. Review.
-
Site-Directed Spin Labeling EPR for Studying Membrane Proteins.Biomed Res Int. 2018 Jan 23;2018:3248289. doi: 10.1155/2018/3248289. eCollection 2018. Biomed Res Int. 2018. PMID: 29607317 Free PMC article. Review.
References
-
- Klug CS, Feix JB. Methods and Applications of Site-Directed Spin Labeling EPR Spectroscopy. Methods Cell Biol. 2008;84:617–658. - PubMed
-
- Fanucci GE, Cafiso DS. Recent advances and applications of site-directed spin labeling. Curr Opinion Struct Biol. 2006;16:644–653. - PubMed
-
- Weil JA, Bolton JR. Electron paramagnetic resonance : Elementary Theory and Practical Applications. Wiley-Interscience; Hoboken, N.J: 2007.
-
- Feher G. Observation of Nuclear Magnetic Resonances via the Electron Spin Resonance Line. Phys Rev. 1956;103:834–835.
-
- Mims WB. Pulsed Endor Experiments. Proceedings of the Royal Society of London Series A Mathematical and Physical Sciences. 1965;283:452–457.
Publication types
MeSH terms
Substances
Grants and funding
LinkOut - more resources
Full Text Sources
Other Literature Sources
