

The frequency and seasonality of influenza and other respiratory viruses in Tennessee: two influenza seasons of surveillance data, 2010-2012
- PMID: 23962104
- PMCID: PMC4634273
- DOI: 10.1111/irv.12145
The frequency and seasonality of influenza and other respiratory viruses in Tennessee: two influenza seasons of surveillance data, 2010-2012
Abstract
Background: In 2010, the Tennessee Department of Health, in collaboration with the Centers for Disease Control and Prevention (CDC), expanded influenza surveillance in Tennessee to include other respiratory viruses.
Objectives: To determine the prevalence and seasonality of influenza and other respiratory viruses during the influenza seasons of 2010-2012.
Methods: Nasal and nasopharangeal swabs/washings from persons with influenza-like illness were collected across Tennessee. Influenza and other respiratory viruses were identified using a molecular-based respiratory virus panel. Influenza A positives were subtyped using real-time PCR according to the CDC protocol. Data were analyzed to describe frequency and seasonality of circulating strains.
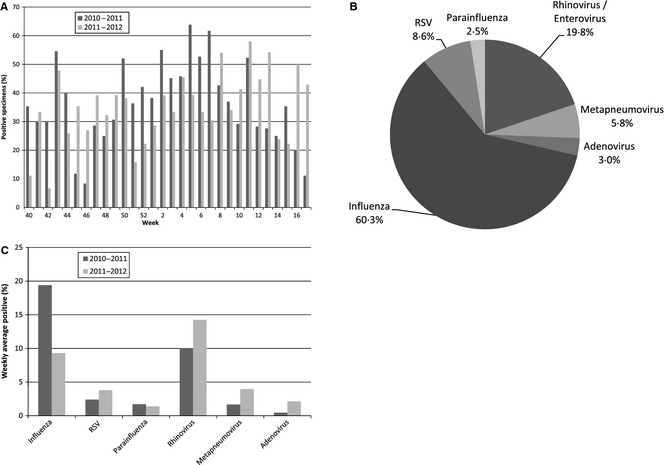
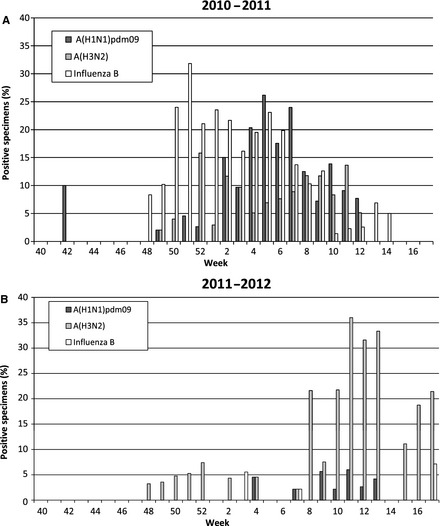
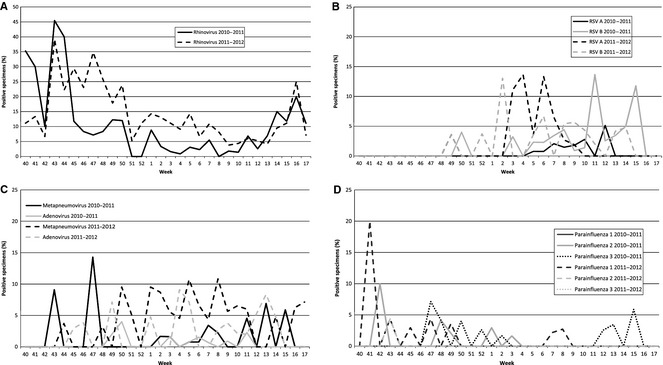
Results: Of the 933 positive specimens, 60·3% were identified as influenza viruses, 19·8% rhinovirus/enterovirus, 8·6% respiratory syncytial virus (RSV), 5·8% metapneumovirus, 3·0% adenovirus, and 2·5% parainfluenza viruses. In the 2010-2011 season, influenza B was prominent during weeks 48-3, while influenza A(H1N1) was most frequently identified during weeks 4-10. Influenza A(H3N2) was present at lower levels during weeks 48-17. However, in the 2011-2012 season, overall numbers of influenza cases were reduced and influenza A (H3N2) was the most abundant influenza strain. The expanded surveillance for other respiratory viruses noted an increase in identified specimens from the first to the second season for adenovirus, metapneumovirus, RSV, and rhinovirus/enterovirus.
Conclusions: This study provides data of the influenza strains in circulation in Tennessee. It also establishes a baseline and time of year to expect other respiratory viruses that will aid in detecting outbreaks of non-influenza respiratory viruses in Tennessee.
Keywords: Adenovirus; Tennessee; influenza; respiratory syncytial virus; rhinovirus; surveillance.
© 2013 John Wiley & Sons Ltd.
Figures
References
-
- 2009 H1N1 early outbreak and disease characteristics. Available at http://www.niaid.nih.gov/topics/Flu/H1N1/GeneralInfo/Pages/factsFigures.... (Accessed 19 July 2012). Centers for Disease Control and Prevention, 2009.
-
- Lawson A, Kleinman K. Spatial and Syndromatic Surveillance for Public Health. Chichester: Wiley, 2005.
-
- Lombardo JS, Buckeridge DL. Disease Surveillance: A Public Health Informatics Approach. Chichester: John Wiley, 2007.
-
- World Health Organization . Standardization of terminology of the pandemic A(H1N1)2009 virus. Available at http://www.who.int/influenza/gisrs_laboratory/terminology_ah1n1pdm09/en/ (Accessed 24 July 2012).
Publication types
MeSH terms
LinkOut - more resources
Full Text Sources
Other Literature Sources
Medical
