

ICU occupancy and mechanical ventilator use in the United States
- PMID: 23963122
- PMCID: PMC3840149
- DOI: 10.1097/CCM.0b013e318298a139
ICU occupancy and mechanical ventilator use in the United States
Abstract
Objectives: Detailed data on occupancy and use of mechanical ventilators in U. S. ICU over time and across unit types are lacking. We sought to describe the hourly bed occupancy and use of ventilators in U.S. ICUs to improve future planning of both the routine and disaster provision of intensive care.
Design: Retrospective cohort study. We calculated mean hourly bed occupancy in each ICU and hourly bed occupancy for patients on mechanical ventilators. We assessed trends in overall occupancy over the 3 years. We also assessed occupancy and mechanical ventilation rates across different types and sizes of ICUs.
Setting: Ninety-seven U.S. ICUs participating in Project IMPACT from 2005 to 2007.
Patients: A total of 226,942 consecutive admissions to ICUs.
Interventions: None.
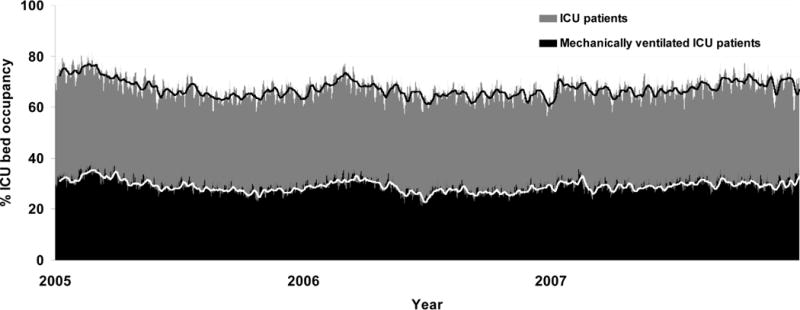
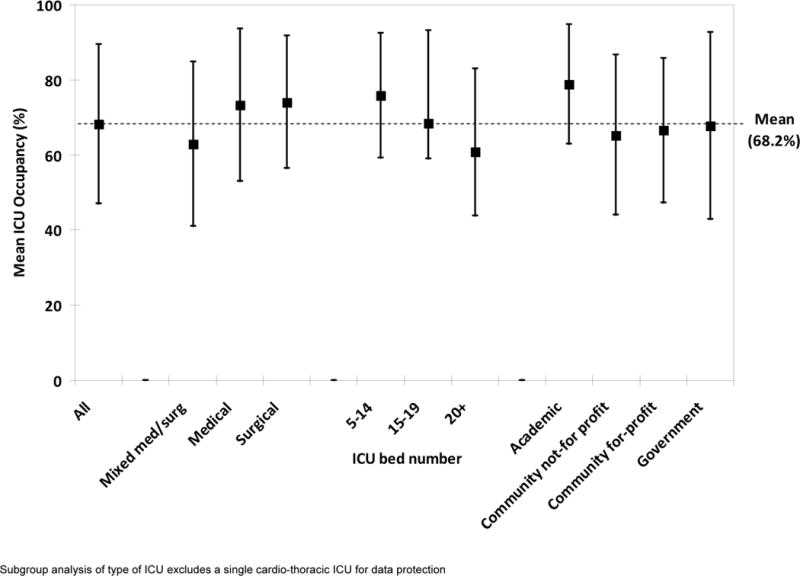
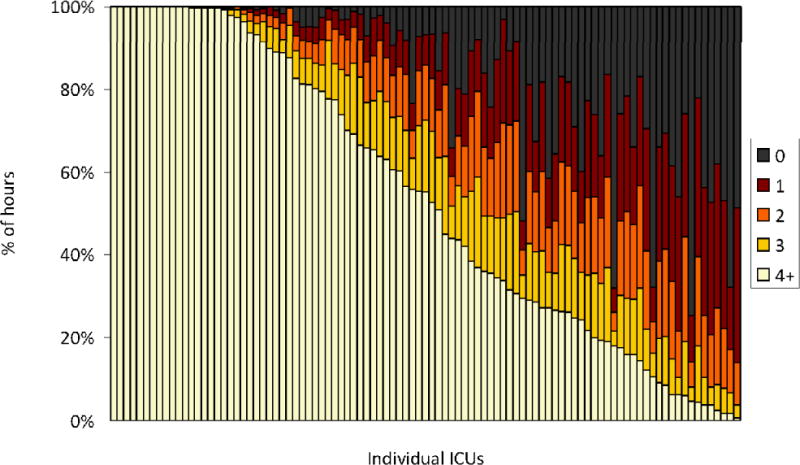
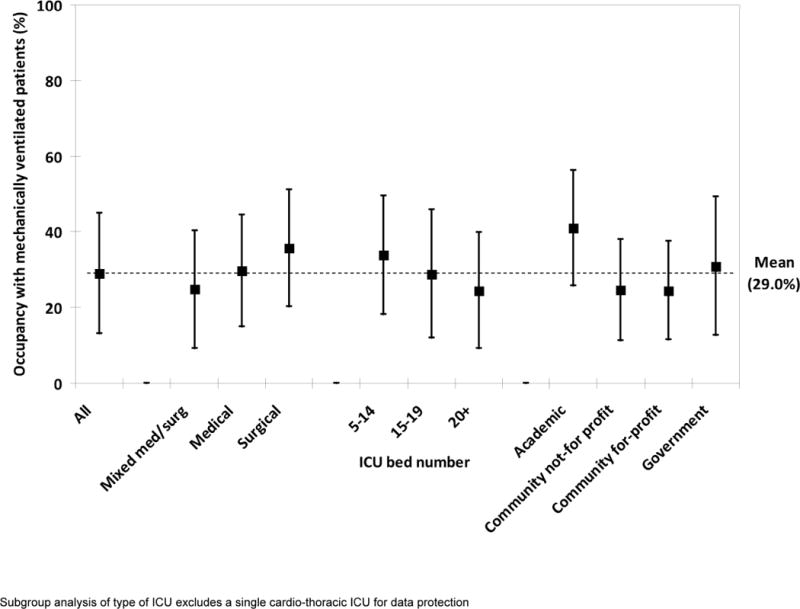
Measurements and main results: Over the 3 years studied, total ICU occupancy ranged from 57.4% to 82.1% and the number of beds filled with mechanically ventilated patients ranged from 20.7% to 38.9%. There was no change in occupancy across years and no increase in occupancy during influenza seasons. Mean hourly occupancy across ICUs was 68.2% ± 21.3% (SD) and was substantially higher in ICUs with fewer beds (mean, 75.8% ± 16.5% for 5-14 beds vs 60.9% ± 22.1% for 20+ beds, p = 0.001) and in academic hospitals (78.7% ± 15.9% vs 65.3% ± 21.3% for community not-for-profit hospitals, p < 0.001). More than half of ICUs (53.6%) had 4+ beds available more than half the time. The mean percentage of ICU patients receiving mechanical ventilation in any given hour was 39.5% (± 15.2%), and a mean of 29.0% (± 15.9%) of ICU beds were filled with a patient on a ventilator.
Conclusions: Occupancy of U.S. ICUs was stable over time, but there is uneven distribution across different types and sizes of units. Only three of 10 beds were filled at any time with mechanically ventilated patients, suggesting substantial surge capacity throughout the system to care for acutely critically ill patients.
Conflict of interest statement
The authors have not disclosed any potential conflicts of interest
Figures
Comment in
-
Goldilocks in the ICU: too few beds, too many, or just right?Crit Care Med. 2013 Dec;41(12):2820-1. doi: 10.1097/CCM.0b013e31829cb2a0. Crit Care Med. 2013. PMID: 24275393 No abstract available.
References
-
- Stelfox HT, Hemmelgarn BR, Bagshaw SM, et al. Intensive care unit bed availability and outcomes for hospitalized patients with sudden clinical deterioration. Arch Intern Med. 2012;172:467–474. - PubMed
-
- Wunsch H, Angus DC, Harrison DA, et al. Variation in critical care services across North America and Western Europe. Crit Care Med. 2008;36:2787–2789. - PubMed
-
- Halpern NA, Pastores SM, Thaler HT, et al. Changes in critical care beds and occupancy in the United States 1985–2000: Differences attributable to hospital size. Crit Care Med. 2006;34:2105–2112. - PubMed
-
- Halpern NA, Pastores SM. Critical care medicine in the United States 2000–2005 an analysis of bed numbers, occupancy rates, payer mix, and costs. Crit Care Med. 2010;38:65–71. - PubMed
Publication types
MeSH terms
Grants and funding
LinkOut - more resources
Full Text Sources
Other Literature Sources
Medical
