. 2013 Aug 20;4(4):e00459-13.
doi: 10.1128/mBio.00459-13.

Interspecies interactions stimulate diversification of the Streptomyces coelicolor secreted metabolome

Affiliations

Interspecies interactions stimulate diversification of the Streptomyces coelicolor secreted metabolome

Matthew F Traxler et al. mBio. .

Abstract

Soils host diverse microbial communities that include filamentous actinobacteria (actinomycetes). These bacteria have been a rich source of useful metabolites, including antimicrobials, antifungals, anticancer agents, siderophores, and immunosuppressants. While humans have long exploited these compounds for therapeutic purposes, the role these natural products may play in mediating interactions between actinomycetes has been difficult to ascertain. As an initial step toward understanding these chemical interactions at a systems level, we employed the emerging techniques of nanospray desorption electrospray ionization (NanoDESI) and matrix-assisted laser desorption ionization-time of flight (MALDI-TOF) imaging mass spectrometry to gain a global chemical view of the model bacterium Streptomyces coelicolor interacting with five other actinomycetes. In each interaction, the majority of secreted compounds associated with S. coelicolor colonies were unique, suggesting an idiosyncratic response from S. coelicolor. Spectral networking revealed a family of unknown compounds produced by S. coelicolor during several interactions. These compounds constitute an extended suite of at least 12 different desferrioxamines with acyl side chains of various lengths; their production was triggered by siderophores made by neighboring strains. Taken together, these results illustrate that chemical interactions between actinomycete bacteria exhibit high complexity and specificity and can drive differential secondary metabolite production.

Importance: Actinomycetes, filamentous actinobacteria from the soil, are the deepest natural source of useful medicinal compounds, including antibiotics, antifungals, and anticancer agents. There is great interest in developing new strategies that increase the diversity of metabolites secreted by actinomycetes in the laboratory. Here we used several metabolomic approaches to examine the chemicals made by these bacteria when grown in pairwise coculture. We found that these interspecies interactions stimulated production of numerous chemical compounds that were not made when they grew alone. Among these compounds were at least 12 different versions of a molecule called desferrioxamine, a siderophore used by the bacteria to gather iron. Many other compounds of unknown identity were also observed, and the pattern of compound production varied greatly among the interaction sets. These findings suggest that chemical interactions between actinomycetes are surprisingly complex and that coculture may be a promising strategy for finding new molecules from actinomycetes.


Figures
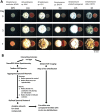
FIG 1
FIG 1
S. coelicolor exhibits a variety of phenotypes in interactions with other actinomycetes. (A) Micrographs of colonies of S. coelicolor grown alone (first column) and near colonies of other actinomycetes. A range of S. coelicolor phenotypes, including differences in pigment production and multicellular development, is visible in interacting colonies over time. The labels M (S. coelicolor M145), A (Amycolatopsis sp. AA4), E (Streptomyces sp. E14), S (Streptomyces sp. SPB74), and V (S. viridochromogenes DSM 40736) are used throughout. (B) Methodological work flow. Each interaction was investigated using NanoDESI and MALDI-TOF imaging mass spectrometry. The resulting spectral networks and ion distributions form a comprehensive data set for analysis of these microbial interactions.
FIG 2
FIG 2
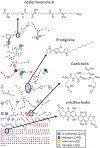
Aggregated and refined spectral network of metabolites observed with NanoDESI during actinomycete interactions. The network is composed of nodes representing ions associated with S. coelicolor colonies grown near another actinomycete (ions found in S. coelicolor colonies grown alone were removed) and ions from initiator colonies. Nodes associated only with S. coelicolor at any time are blue. Nodes associated only with initiators are red. Nodes found only in both an initiator and S. coelicolor at the same time are yellow. Gray indicates nodes with variable behavior (i.e., found in multiple contexts). Representative structures of identified metabolites are shown.
FIG 3
FIG 3
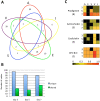
Global analysis of metabolites observed with NanoDESI. (A) Venn analysis of nodes associated with interacting S. coelicolor colonies on day 3. Each ellipse contains nodes found in the indicated interaction. The majority of detected ions fall into the outer zones of the diagram, indicating that each interaction is more unique than it is similar to other interactions. (B) Numbers of unique and shared nodes found at each time point. For each day, the numbers of nodes found only in single interactions were summed to give the total number of unique nodes. Nodes that were found in more than one interaction were summed to find the total number of shared nodes. The number of unique nodes exceeds the number of shared nodes at every time point, suggesting that the response of S. coelicolor is different depending on the interaction. (C) Patterns of known compound production. Each compound family is observed as a subset of nodes within the larger network in Fig. 2. Heat map colors indicate the proportion of active nodes in each interaction. For example, 1.0 indicates that all the nodes associated with a given compound family are active. Three, 5, or 7 represents the sampling time in days. Numbers beneath compound names indicate number of nodes associated with those compounds in Fig. 2. Interactions are labeled as indicated in Fig. 1A. This analysis includes nodes associated with initiator colonies.
FIG 4
FIG 4
Visualization of acyl-desferrioxamine (acyl-DFO) subnetworks and desferrioxamine structures. (A) Acyl-DFOs form four major subnetworks (numbered a1 to a4) within the larger spectral network. Subnetwork a1, circled in black, is magnified in Fig. 5. Subnetworks a2 to a4 are shown in Fig. S2 and S3 at http://gasp.med.harvard.edu/journals/traxler_2013_SI_nanodesi.pdf. (B) Structure 1 at the top constitutes the core desferrioxamine structure, while structure 2 lacks a complete central hydroxamate moiety. Structures 3 to 6 are acyl appendages from known acyl-desferrioxamines (11, 50). MS2 fragmentation patterns and m/z values from molecules bearing 3 to 6 match MS2 fragmentation patterns and m/z values found here to be made by S. coelicolor. The m/z values associated with each structure are 743 (structure 3), 729 (structure 4), 687 (structure 5), and 659 (structure 6).
FIG 5
FIG 5
Patterns of acyl-desferrioxamine production in interspecies interactions. (A) Heat map of acyl-desferrioxamine production. Analysis parameters are identical to those in Fig. 3C. (B) Subnetworks 1 and 2 contain the majority of acyl-desferrioxamines verified by MS2 fragmentation. Fine-scale analysis of subnetwork 1 is shown, illustrating differential acyl-desferrioxamine production in various interactions over time. Note the proximity of subnetwork 1 to desferrioxamine B (DFO B). Subnetworks 3 and 4 contain larger versions of DFOs and sodium adducts, respectively (see Fig. S3 at http://gasp.med.harvard.edu/journals/traxler_2013_SI_nanodesi.pdf). (C) Desferrioxamines are observable using IMS at day 5. m/z 561 and 601 correspond to desferrioxamines B and E, respectively. m/z 701 to 785 are representative acyl-desferrioxamines. Note the production of acyl-desferrioxamines by S. coelicolor in interactions where initiator strains do not make desferrioxamines B and/or E. Each IMS signal is scaled as a single color heat map; brighter color indicates higher signal intensity, and darker indicates lower signal intensity. (D) Acyl-desferrioxamines diffuse away from S. coelicolor colonies in three dimensions. The outermost to innermost layers (isosurfaces) correspond to 0.8, 0.88, and 0.95% ion intensity.
FIG 6
FIG 6
Acyl-desferrioxamine production by S. coelicolor is stimulated by a siderophore from a nearby actinomycete. (A) The actinomycete Amycolatopsis sp. AA4 produces the siderophore amychelin. Sodiated and potassiated adducts of amychelin are visible as an Amycolatopsis sp. AA4-associated subnetwork. (B) Five days IMS of S. coelicolor grown near wild-type Amycolatopsis sp. AA4 and a mutant lacking the gene amcG, which does not produce amychelin. Ion abundance is visualized as a heat map. When grown near the ΔamcG strain, which does not make amychelin, S. coelicolor produces much less of the acyl-desferrioxamines.

References

    1. Baltz RH. 2008. Renaissance in antibacterial discovery from actinomycetes. Curr. Opin. Pharmacol. 8:557–563 - PubMed
    1. Bérdy J. 2005. Bioactive microbial metabolites. J. Antibiot. Tokyo 58:1–26 - PubMed
    1. Clardy J, Fischbach MA, Currie CR. 2009. The natural history of antibiotics. Curr. Biol. 19:R437–R441.10.1016/j.cub.2009.04.001 - DOI - PMC - PubMed
    1. Fischbach MA, Walsh CT. 2009. Antibiotics for emerging pathogens. Science 325:1089–1093 - PMC - PubMed
    1. Challis GL, Hopwood DA. 2003. Synergy and contingency as driving forces for the evolution of multiple secondary metabolite production by Streptomyces species. Proc. Natl. Acad. Sci. U. S. A. 100(Suppl 2):14555–14561 - PMC - PubMed

Publication types

MeSH terms

LinkOut - more resources