. 2013 Oct 21;13(20):4053-64.
doi: 10.1039/c3lc50579k. Epub 2013 Aug 20.

Sensitive detection of protein and miRNA cancer biomarkers using silicon-based photonic crystals and a resonance coupling laser scanning platform

Affiliations

Sensitive detection of protein and miRNA cancer biomarkers using silicon-based photonic crystals and a resonance coupling laser scanning platform

Sherine George et al. Lab Chip. .

Abstract

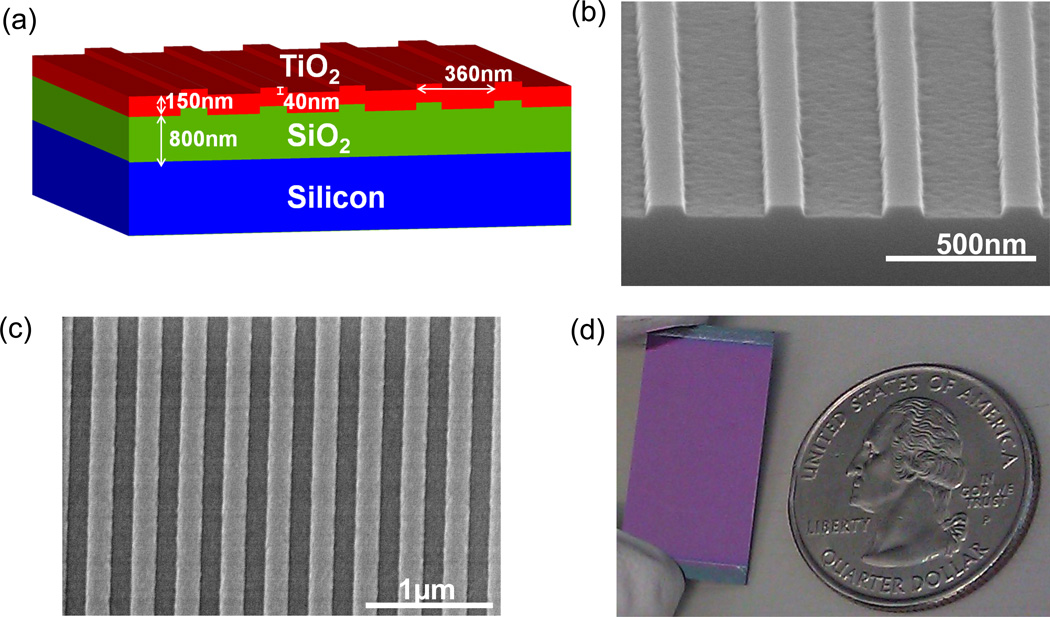
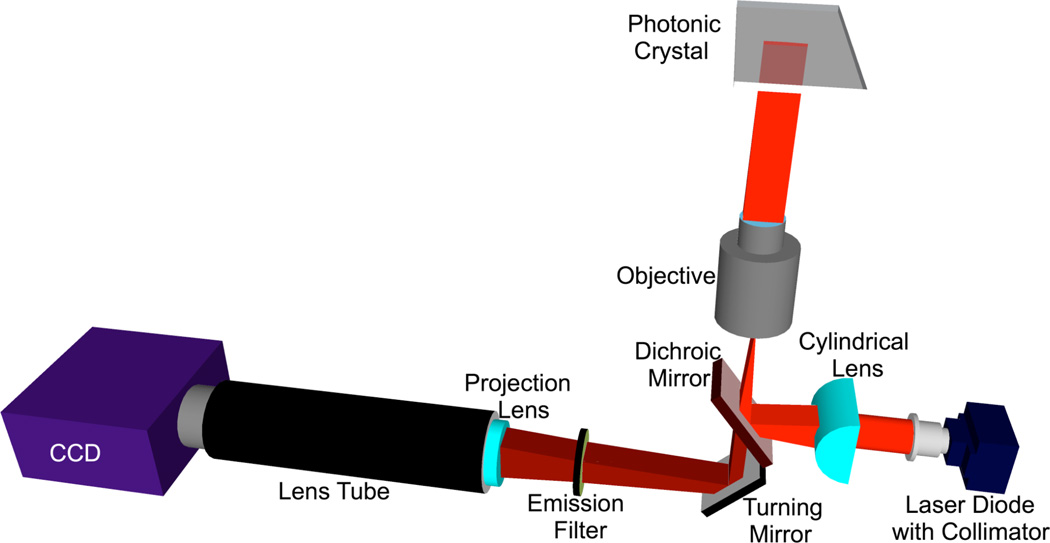
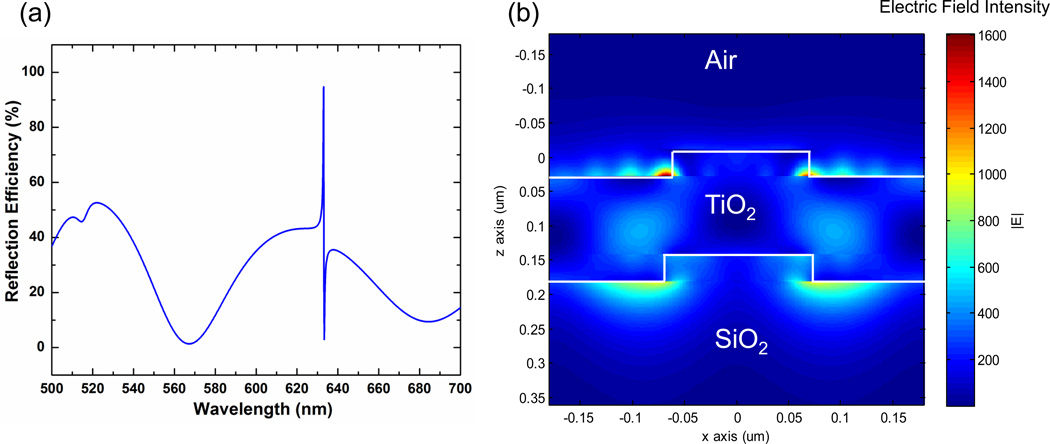
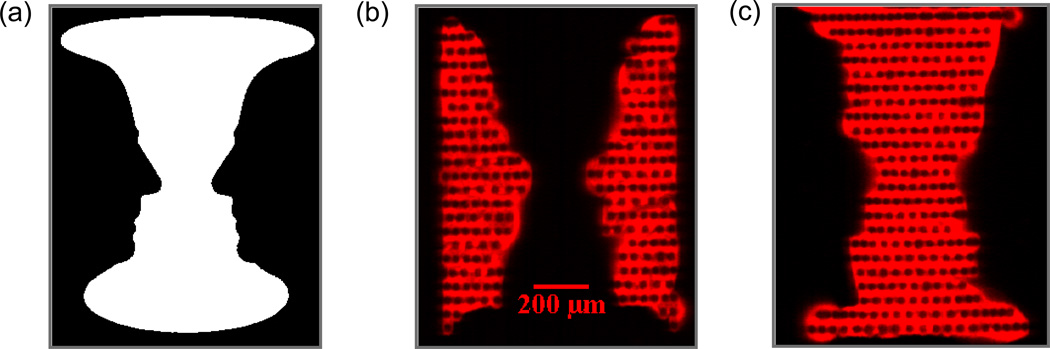
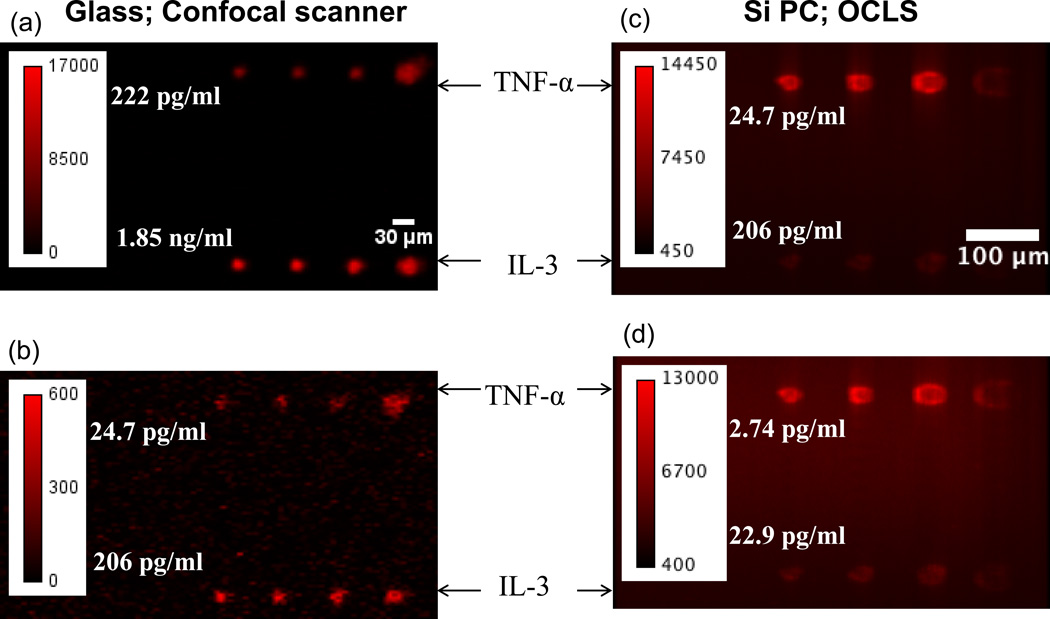
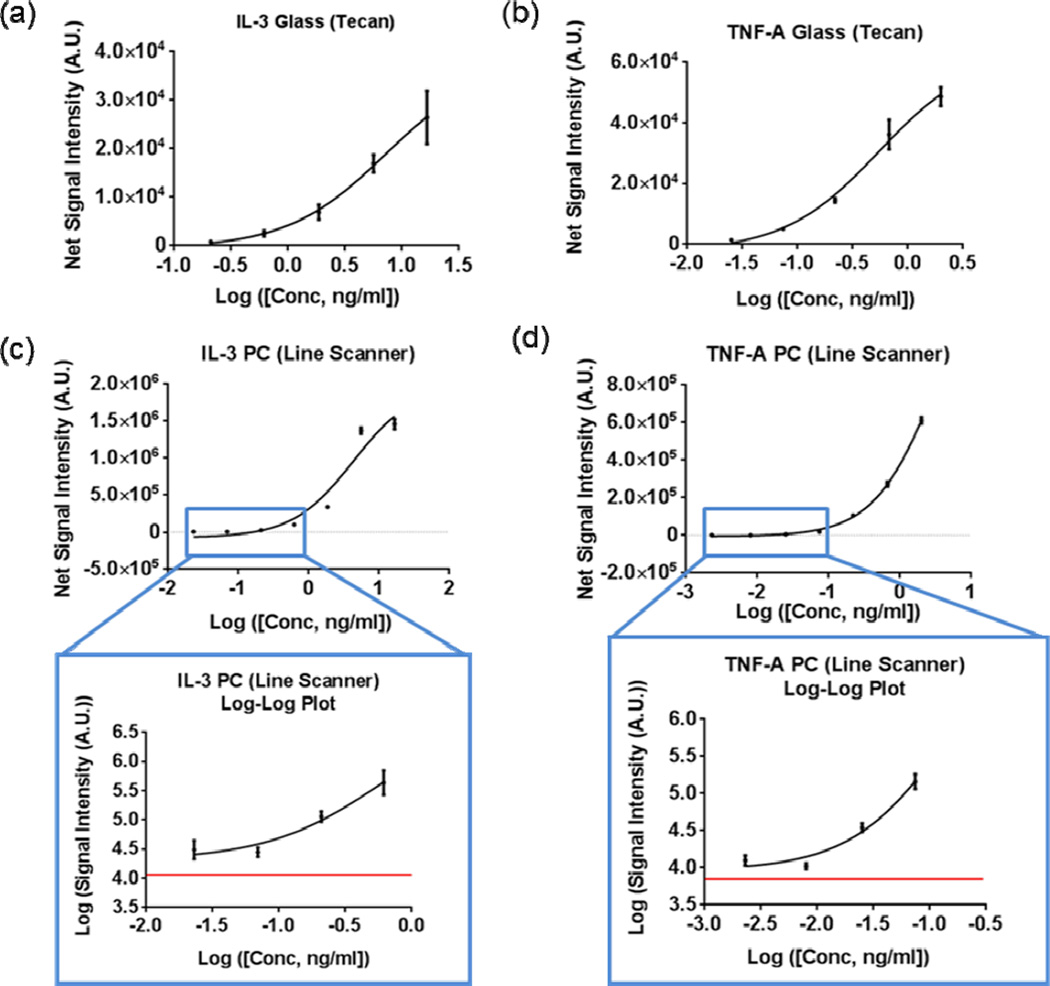
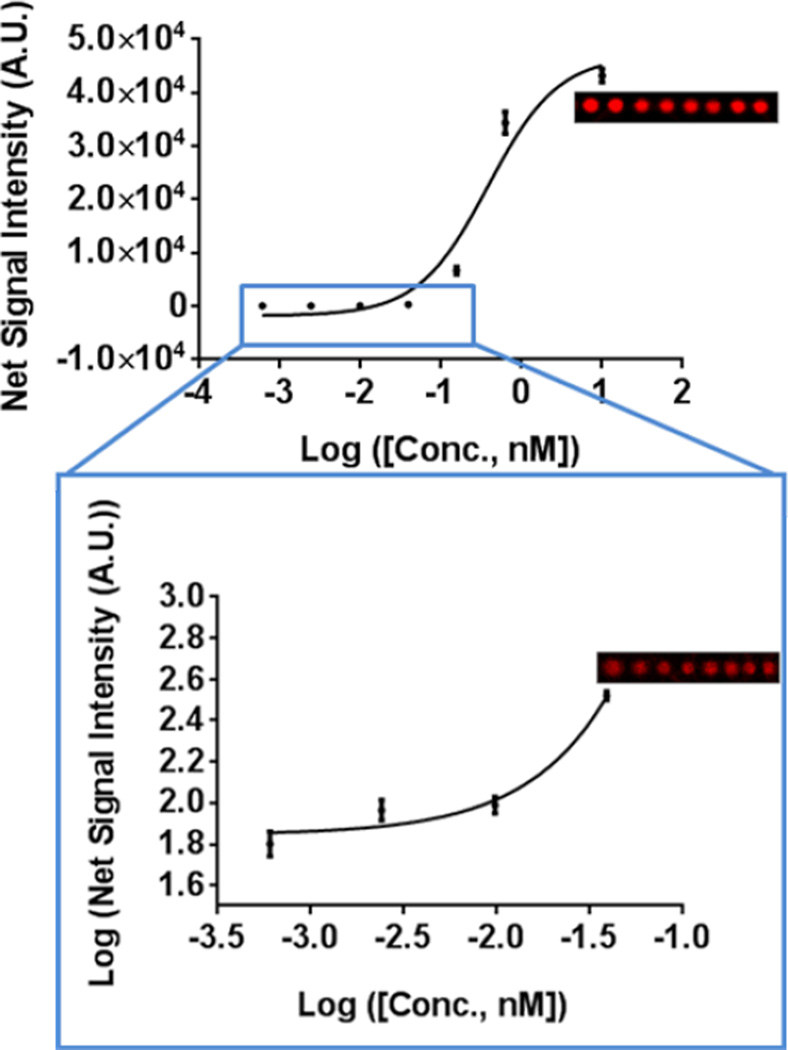
Enhancement of the fluorescent output of surface-based fluorescence assays by performing them upon nanostructured photonic crystal (PC) surfaces has been demonstrated to increase signal intensities by >8000×. Using the multiplicative effects of optical resonant coupling to the PC in increasing the electric field intensity experienced by fluorescent labels ("enhanced excitation") and the spatially biased funneling of fluorophore emissions through coupling to PC resonances ("enhanced extraction"), PC enhanced fluorescence (PCEF) can be adapted to reduce the limits of detection of disease biomarker assays, and to reduce the size and cost of high sensitivity detection instrumentation. In this work, we demonstrate the first silicon-based PCEF detection platform for multiplexed biomarker assay. The sensor in this platform is a silicon-based PC structure, comprised of a SiO2 grating that is overcoated with a thin film of high refractive index TiO2 and is produced in a semiconductor foundry for low cost, uniform, and reproducible manufacturing. The compact detection instrument that completes this platform was designed to efficiently couple fluorescence excitation from a semiconductor laser to the resonant optical modes of the PC, resulting in elevated electric field strength that is highly concentrated within the region <100 nm from the PC surface. This instrument utilizes a cylindrically focused line to scan a microarray in <1 min. To demonstrate the capabilities of this sensor-detector platform, microspot fluorescent sandwich immunoassays using secondary antibodies labeled with Cy5 for two cancer biomarkers (TNF-α and IL-3) were performed. Biomarkers were detected at concentrations as low as 0.1 pM. In a fluorescent microarray for detection of a breast cancer miRNA biomarker miR-21, the miRNA was detectable at a concentration of 0.6 pM.


Conflict of interest statement

Conflict of Interest Statement

BTC has founded a company with the goal of commercializing the PCEF technology. NA is employed by NanoInk, which commercially provides the DPN system used in this work.

Figures

Figure 1
Figure 1
(a) Schematic of the silicon PC device design. (b) SEM cross-sectional view of grating pattern in SiO2 layer before TiO2 coating. Measured grating line width of 131nm and grating depth of 37.7nm. (c) SEM top view of grating after TiO2 coating. Measured grating period of 366 nm.
Figure 2
Figure 2
Schematic of the objective-coupled, line scanning instrument used to acquire fluorescence data at the precise PC resonant angle. Equipped with a solid-state laser diode, this instrument illuminates with the PC with a beam of light that is focused in one plane for higher illumination density but collimated in the other plane for optimally coupling the incident light to the PC.
Figure 3
Figure 3
(a) Reflection spectra of a Si-PC illuminated with a broadband light source and captured at normal incidence (black) and at an incidence angle of 3.5 degrees (red). At an incidence angle of 3.5 degrees, the resonant peak is located at a wavelength of λ=637 nm. (b) Reflection spectra of a Si PC obtained when illuminated with a collimated solid state laser (at λ=637 nm) over a range of illumination angles. All data is normalized to the reflection from a gold mirror.
Figure 4
Figure 4
(a) Reflection efficiency as a function of wavelength for the simulated Si-PC. When illuminated at normal incidence, the device resonance is located at 633nm. (b) Electric field intensity cross section plotted for one period of the device. The maximum field intensity is 1767 times the incident field intensity. When averaged over a 10 nm and 100 nm tall region above the top TiO2 layer, the electric field intensity is 401 times and 135 times the incident field intensity, respectively.
Figure 5
Figure 5
(a) The optical illusion, Rubin’s Vase, shown here as a gray-scale image consists of two reversing figures of a face and a vase. (b–c) Fluorescent images of the two reversing figures obtained by tuning to two distinct PC resonances. The two figures were printed with a Cy5 labeled oligonucleotide and a Cy5 labeled protein, respectively and each figure produced a separate shift in the PC resonance.
Figure 6
Figure 6
Representative fluorescence images of two subarrays on the glass slide (a–b) acquired using a commercial confocal microarray scanner. Two assayed concentrations of (a) 0.22 ng/mL for TNF-α and 1.9 ng/mL for IL-3 and (b) 25 pg/mL for TNF-α and 0.21 ng/mL for IL-3 are presented here. Fluorescent images of two subarrays on the Si PC (c-d) acquired using the OCLS at the following concentrations (a) 25 pg/mL for TNF-α and 0.21 ng/mL for IL-3 and (b) 2.7 pg/mL for TNF-α and 23 pg/mL for IL-3.
Figure 7
Figure 7
Dose response curves obtained on the glass slide for (a) IL-3 and (b) TNF-α. The five highest concentrations out of a total of seven assayed concentrations were detectable on the glass slide. All seven assayed concentrations of (c) IL-3 and (d) TNF-α were detectable on the PC. Fluorescent spot intensities on the PC for the four lowest assayed concentrations, as highlighted in the blue rectangle and magnified, are well above the local background value (red line). Data represents mean ± S.D. values of four replicate spots.
Figure 8
Figure 8
Dose response curve depicting fluorescent spot intensities of miR-21 assayed on the PC over a concentration range of 1.0nM – 0.60pM. All seven assayed concentrations were detectable over the background fluorescence signal with the four lowest assayed concentrations highlighted in the blue rectangle and magnified. The local background is indicated as the red line. Representative fluorescence images of microspots at assayed miR-21 concentrations of 2.5nM and 39pM are presented alongside each graph. Data represents mean ± S.D. values of sixteen replicate spots.

Similar articles

Cited by

References

    1. Basil CF, Zhao Y, Zavaglia K, Jin P, Panelli MC, Voiculescu S, Mandruzzato S, Lee HM, Seliger B, Freedman RS. Cancer research. 2006;66:2953–2961. - PubMed
    1. Zangar RC, Daly DS, White AM. Expert review of proteomics. 2006;3:37–44. - PubMed
    1. Srivastava S. Molecular diagnosis & therapy. 2006;10:221–230. - PubMed
    1. Sanchez-Carbayo M, Socci ND, Lozano JJ, Haab BB, Cordon-Cardo C. The American journal of pathology. 2006;168:93–103. - PMC - PubMed
    1. Masson S, Latini R, Anand IS, Vago T, Angelici L, Barlera S, Missov ED, Clerico A, Tognoni G, Cohn JN. Clinical chemistry. 2006;52:1528–1538. - PubMed

Publication types

LinkOut - more resources