

Empagliflozin as add-on to metformin plus sulfonylurea in patients with type 2 diabetes: a 24-week, randomized, double-blind, placebo-controlled trial
- PMID: 23963895
- PMCID: PMC3816918
- DOI: 10.2337/dc12-2673
Empagliflozin as add-on to metformin plus sulfonylurea in patients with type 2 diabetes: a 24-week, randomized, double-blind, placebo-controlled trial
Abstract
Objective: To investigate the efficacy and tolerability of empagliflozin as add-on to metformin and sulfonylurea in patients with type 2 diabetes.
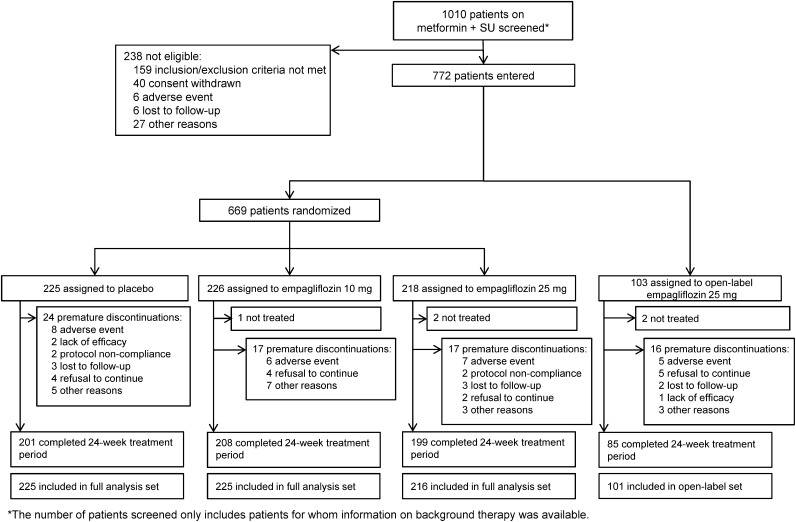
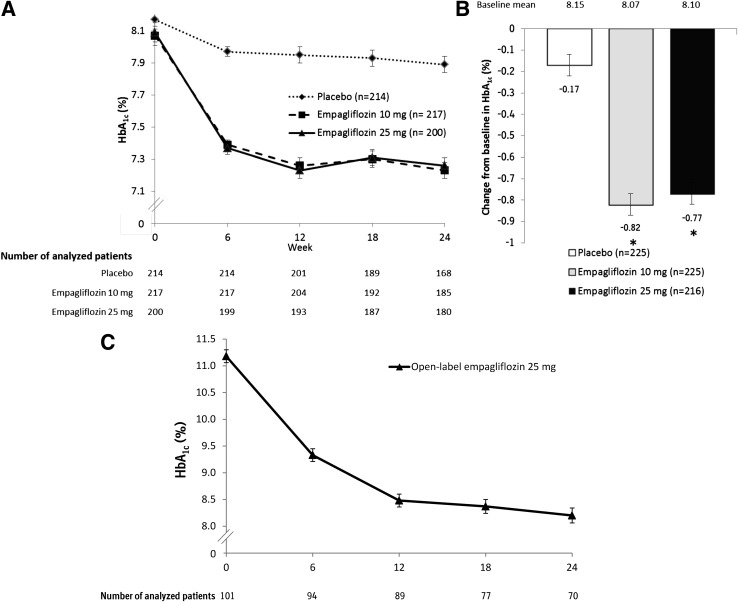
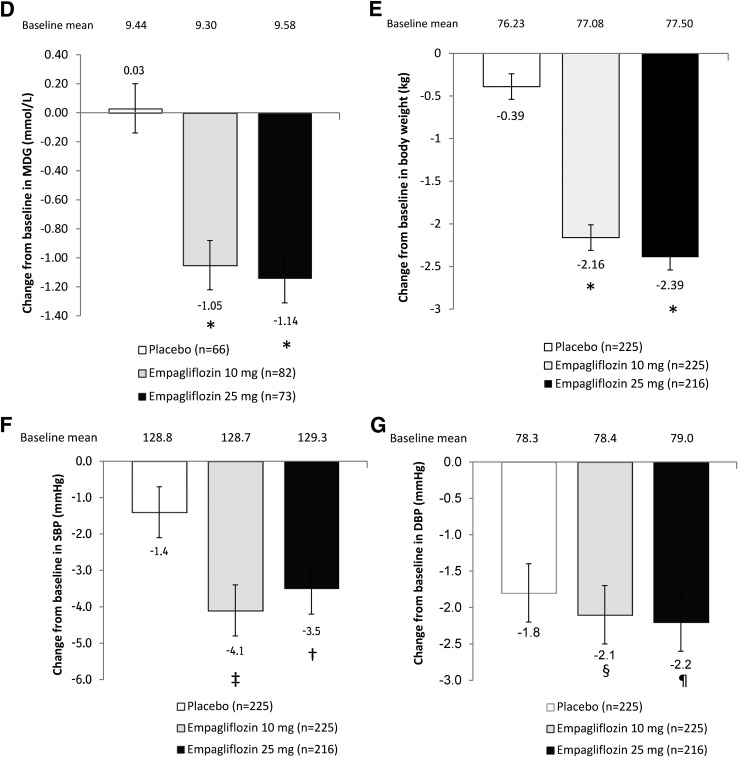
Research design and methods: Patients inadequately controlled on metformin and sulfonylurea (HbA1c ≥7 to ≤10%) were randomized and treated with once-daily empagliflozin 10 mg (n = 225), empagliflozin 25 mg (n = 216), or placebo (n = 225) for 24 weeks. The primary end point was change from baseline in HbA1c at week 24. Key secondary end points were changes from baseline in weight and mean daily glucose (MDG) at week 24.
Results: At week 24, adjusted mean (SE) changes from baseline in HbA1c were -0.17% (0.05) for placebo vs. -0.82% (0.05) and -0.77% (0.05) for empagliflozin 10 and 25 mg, respectively (both P < 0.001). Empagliflozin significantly reduced MDG, weight, and systolic (but not diastolic) blood pressure versus placebo. Adverse events were reported in 62.7, 67.9, and 64.1% of patients on placebo and empagliflozin 10 and 25 mg, respectively. Events consistent with urinary tract infection were reported in 8.0, 10.3, and 8.3% of patients on placebo and empagliflozin 10 and 25 mg, respectively (females: 13.3, 18.0, and 17.5%, respectively; males: 2.7, 2.7, and 0%, respectively). Events consistent with genital infection were reported in 0.9, 2.7, and 2.3% of patients on placebo and empagliflozin 10 and 25 mg, respectively (females: 0.9, 4.5, and 3.9%, respectively; males: 0.9% in each group).
Conclusions: Empagliflozin 10 and 25 mg for 24 weeks as add-on to metformin plus sulfonylurea improved glycemic control, weight, and systolic blood pressure and were well tolerated.
Trial registration: ClinicalTrials.gov NCT01159600.
Figures
Comment in
-
Empagliflozin added to metformin and sulfonylurea therapy in patients with sub-optimally controlled type 2 diabetes mellitus.Expert Opin Pharmacother. 2015 Apr;16(5):781-4. doi: 10.1517/14656566.2015.1009445. Epub 2015 Feb 3. Expert Opin Pharmacother. 2015. PMID: 25644093
References
-
- Inzucchi SE, Bergenstal RM, Buse JB, et al. Management of hyperglycaemia in type 2 diabetes: a patient-centered approach. Position statement of the American Diabetes Association (ADA) and the European Association for the Study of Diabetes (EASD). Diabetologia 2012;55:1577–1596 - PubMed
-
- Kahn SE, Haffner SM, Heise MA, et al. ADOPT Study Group Glycemic durability of rosiglitazone, metformin, or glyburide monotherapy. N Engl J Med 2006;355:2427–2443 - PubMed
-
- Ng JM, Mellor DD, Masson EA, Allan BJ. Sulphonyurea as a cause of severe hypoglycaemia in the community. Prim Care Diabetes 2010;4:61–63 - PubMed
-
- Phung OJ, Scholle JM, Talwar M, Coleman CI. Effect of noninsulin antidiabetic drugs added to metformin therapy on glycemic control, weight gain, and hypoglycemia in type 2 diabetes. JAMA 2010;303:1410–1418 - PubMed
Publication types
MeSH terms
Substances
Associated data
LinkOut - more resources
Full Text Sources
Other Literature Sources
Medical
