

Macrophage PPAR gamma Co-activator-1 alpha participates in repressing foam cell formation and atherosclerosis in response to conjugated linoleic acid
- PMID: 23964012
- PMCID: PMC3799497
- DOI: 10.1002/emmm.201302587
Macrophage PPAR gamma Co-activator-1 alpha participates in repressing foam cell formation and atherosclerosis in response to conjugated linoleic acid
Abstract
Conjugated linoleic acid (CLA) has the unique property of inducing regression of pre-established murine atherosclerosis. Understanding the mechanism(s) involved may help identify endogenous pathways that reverse human atherosclerosis. Here, we provide evidence that CLA inhibits foam cell formation via regulation of the nuclear receptor coactivator, peroxisome proliferator-activated receptor (PPAR)-γ coactivator (PGC)-1α, and that macrophage PGC-1α plays a role in atheroprotection in vivo. PGC-1α was identified as a hub gene within a cluster in the aorta of the apoE(-/-) mouse in the CLA-induced regression model. PGC-1α was localized to macrophage/foam cells in the murine aorta where its expression was increased during CLA-induced regression. PGC-1α expression was also detected in macrophages in human atherosclerosis and was inversely linked to disease progression in patients with the disease. Deletion of PGC-1α in bone marrow derived macrophages promoted, whilst over expression of the gene inhibited foam cell formation. Importantly, macrophage specific deletion of PGC-1α accelerated atherosclerosis in the LDLR(-/-) mouse in vivo. These novel data support a functional role for PGC-1α in atheroprotection.
Keywords: PGC-1α; atherosclerosis regression; conjugated linoleic acid; foam cell formation.
© 2013 The Authors. Published by John Wiley and Sons, Ltd on behalf of EMBO.
Figures
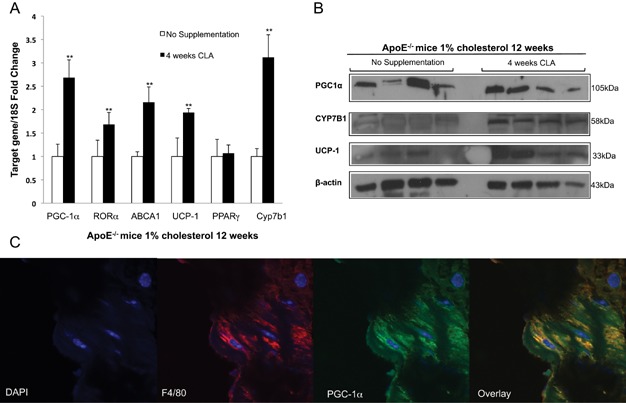
Validation of gene network in vivo showing mRNA expression of PGC-1α, RORα and ABCA1 and expression of known (PPARγ1 and UCP-1) and putative (CYP7b1) PGC-1α target genes in aorta of apoE−/− fed a 1% cholesterol chow for 12 weeks with (n = 5) or without (n = 5) 1% CLA supplementation for the final 4 weeks.
Western blot analysis of PGC-1α, UCP-1 and Cyp7b1 confirmed CLA-mediated induction of PGC-1α in murine aorta.
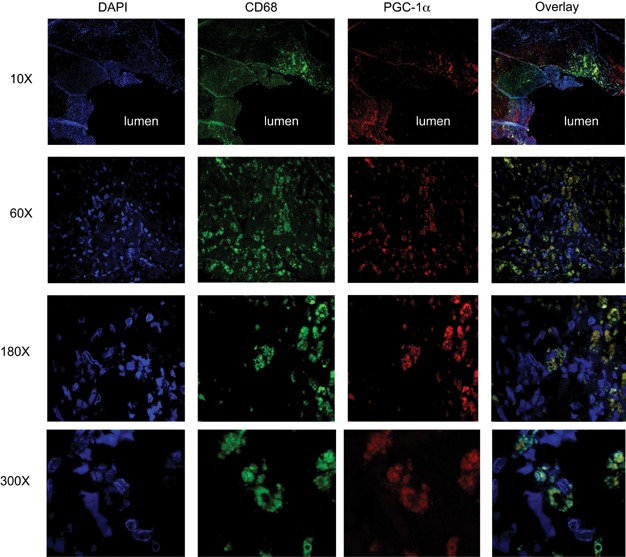
PGC-1α (green) was localized to macrophages as confirmed by confocal microscopy staining with F4/80 (red) specific macrophage marker. Overlay shows co-localization of PGC-1α and F4/80. Nuclei are stained with DAPI and are show in blue. Data are the mean ± SEM of five independent experiments. Statistical analyses were performed using t-test. Significant p-values from left to right are as follows: p = 0.0013, 0.0103, 0.0054, 0.0092 and 0.0045 for PGC-1α, RORα, ABCA1, UCP-1 and Cyp7b1, respectively, versus apoE−/− 1% cholesterol 12 weeks.
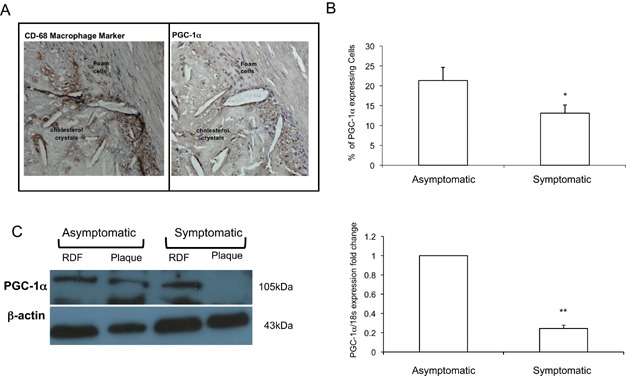
Immunohistochemical analysis of CD68 positive macrophage cells and PGC-1α expression in human atherosclerotic plaque.
Quantification of PGC-1α expression using Aperio Software Analysis System nuclear analysis algorithm.
Western blot and real time PCR analysis of PGC-1α expression in symptomatic and asymptomatic plaques. Data represent the mean ± SEM of five independent experiments.
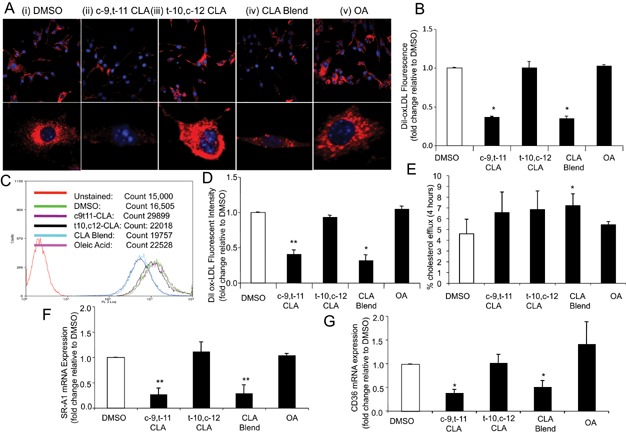
A. Confocal microscopy of Dil-oxLDL (red) accumulation at 20× and 63× magnification. Nuclei are stained with DAPI (blue).
B. Dil ox-LDL in the cells was quantified by Zeiss LSM Image Examiner.
C. Representative flow cytometry analysis of dil ox-LDL Fluorescence signals detected at 555–600 nm.
D. Quantification of flow cytometry analysis showing fold change in fluorescence intensity relative to DMSO.
E. % [3H] cholesterol efflux of acLDL loaded RAW 264.7 macrophages towards HDL, at 4 h when compared to time zero following pre treatment with CLA isomers, CLA blend or OA.
F, G. mRNA expression of (F) SR-A1 and (G) CD36. Data are the mean ± SEM of three independent experiments.
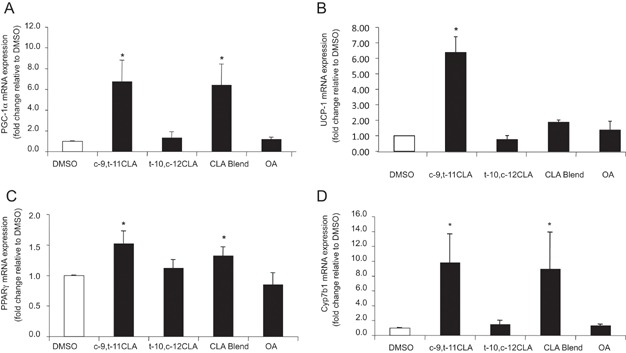
A–D. CLA and control lipids treatment on mRNA expression of (A) PGC-1α, (B) PPARγ1, (C) UCP-1 and (D) Cyp7b1 in oxLDL treated RAW 264.7 macrophages by real time PCR analysis. Cells were treated as described in Fig 4. Data represent the mean ± SEM of three independent experiments. Statistical analyses were performed by ANOVA. Significant p-values are (A) p = 0.028 for c9t11-CLA, p = 0.031 for CLA blend; (B) p = 0.017 for c9t11-CLA; (C) p = 0.043 for c9t11-CLA, p = 0.041 for CLA blend and (D) p = 0.029 for c9t11-CLA, p = 0.035 for CLA blend versus DMSO control.
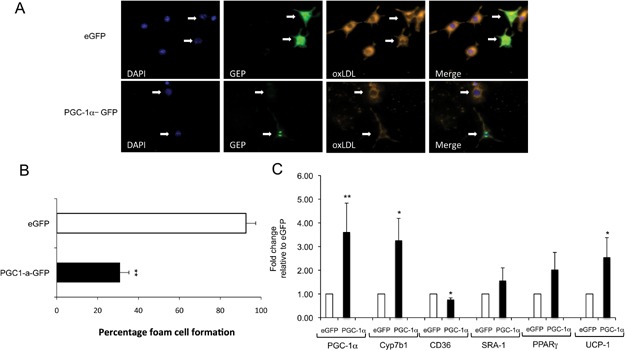
RAW 264.7 macrophages were transfected with a pEGFP-C1 vector alone (top panel) or with a pEGFP-C1 construct containing PGC-1α (lower panel) and treated with oxLDL as before. GFP positive cells are indicated by green, oxLDL is shown in yellow. Arrows indicated GFP transfected cells.
Quantification of oxLDL uptake inhibition in GFP positive cells expressing PGC-1α versus control cells. Data represent the mean ± SEM of three independent experiments. Statistical analyses were performed by t-test, p = 0.0026 versus eGFP.
mRNA expression of PGC-1α, Cyp7b1, CD36, SRA-1, PPARγ1 and UCP-1 in PGC-1α transfected cells compared with controls. Data represents the mean ± SEM of three independent experiments. Statistical analyses were performed by t-test. Significant p-values are as follows: p = 0.0082 for PGC-1α, p = 0.038 for Cyp7b1, p = 0.011 for CD36 and p = 0.0106 for UCP-1 versus eGFP.
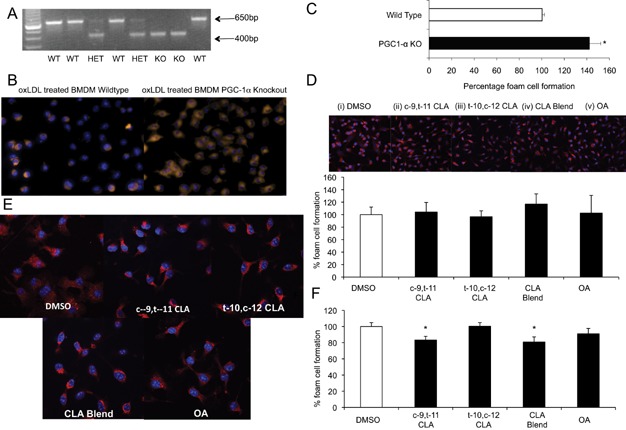
A. PCR products of genomic DNA from PGC-1α−/− (KO, 650-bp), PGC-1α+/+ (WT, 400-bp) and PGC-1α+/− animals.
B, C. (B) Fluorescence microscopy with oxLDL in yellow and DAPI stained nuclei in blue and (C) Quantification of foam cell formation in BMDMs from WT and KO mice treated with 50 μg oxLDL. Data represents the mean ± SEM of three independent experiments. Statistical analyses were performed by t-test, p = 0.032 versus wildtype.
D, E. (D) Confocal microscopy at 20× and quantification of foam cell formation in BMDMs from PGC-1α−/− mice pre-treated with 25 μM CLA isomers, CLA blend and OA followed by oxLDL (shown in red) and (E) Confocal microscopy at 63× of foam cell formation in BMDMs from PGC-1α−/− mice pre-treated with CLA isomers and controls. Nuclei are stained with DAPI (blue).
F. Quantification of foam cell formation in BMDMs from PGC-1α+/+ mice pre-treated with 25 μM CLA isomers, CLA blend and OA followed by oxLDL. Data represents the mean ± SEM of three independent experiments. Statistical analyses were performed by t-test, p = 0.039 for c9t11CLA and p = 0.041 for CLA blend versus DMSO.
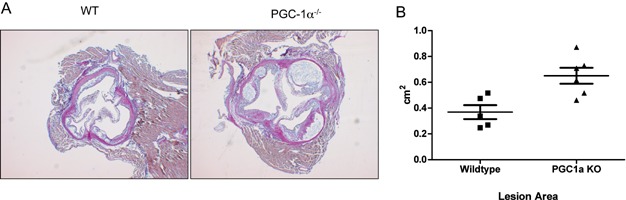
A, B. (A) Representative images of atherosclerotic lesion formation and (B) Quantification of atherosclerosis lesion formation in LDLR−/− mice transplanted with Wildtype (WT) and PGC-1α−/− (KO) bone marrow cells administered a high cholesterol diet for 4 months. PGC-1α−/− transplanted mice show a significant increase in the size of atherosclerotic lesions. Data represent the mean ± SEM of five independent experiments. Statistical analyses were performed by Mann-Whitney test, p = 0.0177.
References
-
- Arbonés-Mainar JM, Navarro MA, Guzmán MA, Arnal C, Surra JC, Acín S, Carnicer R, Osada J, Roche HM. Selective effect of conjugated linoleic acid isomers on atherosclerotic lesion development in apolipoprotein E knockout mice. Atherosclerosis. 2006;189:318–327. - PubMed
-
- Babaev VR, Yancey PG, Ryzhov SV, Kon V, Breyer MD, Magnuson MA, Fazio S, Linton MF. Conditional knockout of macrophage PPARgamma increases atherosclerosis in C57BL/6 and low-density lipoprotein receptor-deficient mice. Arterioscler Thromb Vasc Biol. 2005;25:1647–1653. - PubMed
-
- Bassaganya-Riera J, Reynolds K, Martino-Catt S, Cui Y, Hennighausen L, Gonzalez F, Rohrer J, Benninghoff AU, Hontecillas R. Activation of PPAR gamma and delta by conjugated linoleic acid mediates protection from experimental inflammatory bowel disease. Gastroenterology. 2004;127:777–791. - PubMed
-
- Chen Z, Ishibashi S, Perrey S, Osuga J, Gotoda T, Kitamine T, Tamura Y, Okazaki H, Yahagi N, Iizuka Y, et al. Troglitazone inhibits atherosclerosis in apolipoprotein E-knockout mice: Pleiotropic effects on CD36 expression and HDL. Arterioscler Thromb Vasc Biol. 2001;21:372–377. - PubMed
Publication types
MeSH terms
Substances
Grants and funding
LinkOut - more resources
Full Text Sources
Other Literature Sources
Medical
Miscellaneous
