. 2013 Aug;25(8):3010-21.
doi: 10.1105/tpc.113.113621. Epub 2013 Aug 20.

Conformational changes represent the rate-limiting step in the transport cycle of maize sucrose transporter1

Affiliations

Conformational changes represent the rate-limiting step in the transport cycle of maize sucrose transporter1

Carmen Derrer et al. Plant Cell. 2013 Aug.

Abstract

Proton-driven Suc transporters allow phloem cells of higher plants to accumulate Suc to more than 1 M, which is up to ~1000-fold higher than in the surrounding extracellular space. The carrier protein can accomplish this task only because proton and Suc transport are tightly coupled. This study provides insights into this coupling by resolving the first step in the transport cycle of the Suc transporter SUT1 from maize (Zea mays). Voltage clamp fluorometry measurements combining electrophysiological techniques with fluorescence-based methods enable the visualization of conformational changes of SUT1 expressed in Xenopus laevis oocytes. Using the Suc derivate sucralose, binding of which hinders conformational changes of SUT1, the association of protons to the carrier could be dissected from transport-associated movements of the protein. These combined approaches enabled us to resolve the binding of protons to the carrier and its interrelationship with the alternating movement of the protein. The data indicate that the rate-limiting step of the reaction cycle is determined by the accessibility of the proton binding site. This, in turn, is determined by the conformational change of the SUT1 protein, alternately exposing the binding pockets to the inward and to the outward face of the membrane.


Figures

Figure 1.
Figure 1.
Competitive Inhibition of Suc-Induced Maize SUT1 Currents by Sucralose. (A) Normalized steady state currents (ISS norm) were recorded in the presence of 100 mM sugar at a holding potential (VH) of −100 mV and pH 5.6 (n = 4, ±sd). ISS currents were normalized to the currents observed in the presence of 100 mM Suc. (B) Suc-induced negative inward currents (ISS) at −20 mV at pH 4.0 were suppressed upon application of sucralose (scl). (C) Inhibition (in %) of Suc-induced transport currents at −100 mV were plotted as a function of the external sucralose concentration. At pH 5.6 (circles), a constant Suc concentration of 5 mM was present, whereas at pH 4.0 (triangles), 1 mM Suc was present. The half maximal inhibitor concentration (IC50) was calculated with a Michaelis-Menten function. Steady state currents of individual cells were normalized to the extrapolated maximal inhibition (=100% inhibition) at −100 mV (n ≥ 4, ±sd). (D) Competitive inhibition of Suc-induced currents by sucralose. Steady state currents measured at −100 mV and pH 4.0 were plotted as a function of the external Suc concentration. Steady state currents were normalized to the currents at −100 mV and 3 mM Suc. Experiments were performed either in the presence (circles) or absence of 10 mM sucralose (triangles). The dose response could be described with a Michaelis-Menten function, resulting in the Km (Suc) in the absence or presence of sucralose (n = 4, ±sd). (E) Membrane capacitance (Cm) changes in response to 0 mM (triangles) or 100 mM Suc (squares) or 100 mM sucralose (circles) at pH 4.0 were plotted against the voltage. Application of saturating Suc concentrations dramatically decreased Cm, whereas sucralose decreased the Cm only slightly. Cm values were normalized to the value at −10 mV in the absence of Suc (n = 7, ±sd).
Figure 2.
Figure 2.
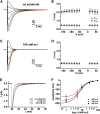
Pre–Steady State Currents of Maize SUT1 at pH 4.0. (A) Pre–steady state currents (Ipre) were obtained by subtracting the stationary currents in the presence of saturating Suc concentration (100 mM Suc) from currents in the absence of Suc (0 mM Suc). The pre–steady state currents could be approximated by a sum of two exponential functions indicated as a red line for the −160 mV current trace. Starting at a holding voltage of −20 mV, voltage pulses from +40 mV to −160 mV in 40-mV decrements were applied. (B) Time constants of the decay of the pre–steady state currents in the absence of substrate versus the applied voltage. The fit of pre–steady state currents (as shown in [A]) by a sum of two exponential functions revealed two time constants: τfast (triangles) and τslow (circles). The value of the fast time constant was smaller than 1 ms and was thus limited by the speed of the voltage clamp (n = 6, ±sd). (C) Pre–steady state currents in the presence of sucralose (scl) were obtained by subtracting the stationary currents in the presence of 100 mM Suc from currents in the presence of 100 mM sucralose. The same voltage protocol as in (A) was applied. In contrast with the pre–steady state currents measured in the absence of any substrate, the pre–steady state currents in the presence of sucralose could be well approximated by a single exponential function indicated as red line for the −160 mV current trace. (D) Time constant of the decay of the pre–steady state currents in the presence of 100 mM sucralose was plotted against the applied voltage. Note, the slow time constant disappeared, while τfast remained apparently unaffected in the presence of the competitive inhibitor sucralose (n = 6, ±sd). (E) Representative pre–steady state current traces in the presence of varying sucralose concentrations recorded at −160 mV: 0 mM (black), 5 mM (red), and 100 mM sucralose (blue). (F) Amplitude of the slow pre–steady state current component plotted against the logarithmic sucralose concentration at −100 mV (blue), −130 mV (red), and −160 mV (black) (n = 7 each, ±sd). The dose–response curve could be best described with Hill equations (Equation 4; solid lines). All experiments were performed in standard bath solutions at pH 4.0. Substrate concentrations are indicated.
Figure 3.
Figure 3.
Voltage-Dependent Fluorescence Changes of TMRM-Labeled SUT1 Expressed in Oocytes. Following expression in X. laevis oocytes, maize SUT1 mutants were labeled with TMRM and voltage-dependent fluorescence changes were measured. (A) Starting from −20 mV, the oocytes were clamped to membrane potentials in the range from +80 to −200 mV in 10-mV decrements. For clarity, only four voltage pulses are shown. The LED-based excitation light was switched on before the voltage pulses were applied and the fluorescence intensity was recorded. (B) to (D) As negative control, the fluorescence intensity of TMRM-labeled SUT1, SUT1-Cys-3–expressing oocytes, and noninjected oocytes was measured in the absence of substrate and in the presence of 100 mM Suc at pH 4.0. Representative original fluorescence recordings showed no detectable voltage-dependent fluorescence changes under any tested condition. WT, the wild type. (E) to (H) Four mutants (SUT1-Y61C, -V62C, -T64C, and -T72C) showed voltage-induced fluorescence changes. The fluorescence was recorded in the absence of substrate and in the presence of Suc at pH 4.0.
Figure 4.
Figure 4.
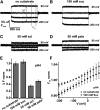
Voltage-Dependent Fluorescence Changes of TMRM-Labeled SUT1-T72C Expressed in Oocytes. Following expression in X. laevis oocytes, SUT1-T72C was labeled with TMRM and voltage-dependent fluorescence changes were measured. (A) to (D) Representative original fluorescence recordings of TMRM-labeled SUT1-T72C under indicated conditions at pH 4.0. Note, fast voltage-dependent fluorescence changes in the presence and absence of Suc appeared to be almost identical. However, application of the competitive inhibitor sucralose (scl) or isomaltulose (isomal) significantly reduced the voltage-dependent fluorescence signal at all tested membrane potentials. (E) The amplitude of the fluorescence change between the extreme voltages +80 mV and −200 mV (ΔF) (see [A]) is shown at pH 4.0 and either 100 mM Suc, 50 mM sucralose, 50 mM isomaltulose, or in the absence of substrate. ΔF demonstrates that the fluorescence amplitude significantly decreased in the presence of sucralose (n = 16, ±se). (F) Steady state fluorescence (FSS; indicated in [A]) monitored with SUT1-T72C–expressing oocytes at pH 4.0 in the absence (triangles) and presence of 100 mM Suc (circles) plotted as a function of voltage. FSS was normalized to the fluorescence at −100 mV in the absence of Suc at pH 4.0 (n = 16, ±sd).
Figure 5.
Figure 5.
Schematic Representation of the First Steps in the Reaction Cycle of Maize SUT1. The unbound Suc transporter alternates with voltage-independent rate constants KEC and KCE between two conformations (1↔2) exposing its H+ and Suc binding sites either to the extracellular (out; 2) or the intracellular face (in; 1). Extracellular protons can enter the transmembrane electrical field and associate with the transporter (3; rate constant [H]⋅KE1). Extracellular application of sucralose (scl) blocks the transporter in the outward-facing conformation (4 and 5).

Similar articles

Cited by

References

    1. Abramson J., Smirnova I., Kasho V., Verner G., Kaback H.R., Iwata S. (2003). Structure and mechanism of the lactose permease of Escherichia coli. Science 301: 610–615 - PubMed
    1. Aoki N., Hirose T., Scofield G.N., Whitfeld P.R., Furbank R.T. (2003). The sucrose transporter gene family in rice. Plant Cell Physiol. 44: 223–232 - PubMed
    1. Aoki N., Hirose T., Takahashi S., Ono K., Ishimaru K., Ohsugi R. (1999). Molecular cloning and expression analysis of a gene for a sucrose transporter in maize (Zea mays L.). Plant Cell Physiol. 40: 1072–1078 - PubMed
    1. Becker D., Dreyer I., Hoth S., Reid J.D., Busch H., Lehnen M., Palme K., Hedrich R. (1996). Changes in voltage activation, Cs+ sensitivity, and ion permeability in H5 mutants of the plant K+ channel KAT1. Proc. Natl. Acad. Sci. USA 93: 8123–8128 - PMC - PubMed
    1. Boorer K.J., Frommer W.B., Bush D.R., Kreman M., Loo D.D., Wright E.M. (1996b). Kinetics and specificity of a H+/amino acid transporter from Arabidopsis thaliana. J. Biol. Chem. 271: 2213–2220 - PubMed

Publication types

MeSH terms

Associated data

LinkOut - more resources