

Independent validation of a model using cell line chemosensitivity to predict response to therapy
- PMID: 23964133
- PMCID: PMC3955959
- DOI: 10.1093/jnci/djt202
Independent validation of a model using cell line chemosensitivity to predict response to therapy
Abstract
Background: Methods using cell line microarray and drug sensitivity data to predict patients' chemotherapy response are appealing, but groups may be reluctant to release details to preserve intellectual property. Here we describe a case study to validate predictions while treating the methods as a "black box."
Methods: Medical Prognosis Institute (MPI) constructed cell-line-derived sensitivity scores (SSs) and combined scores (CSs) that incorporate clinical variables. MD Anderson researchers evaluated their predictions. We searched the Gene Expression Omnibus (GEO) to identify validation datasets, and we performed statistical evaluation of the agreement between prediction and clinical observation.
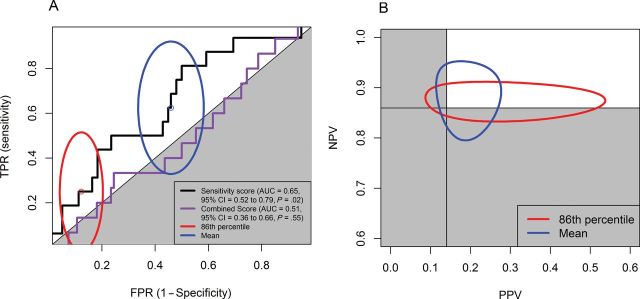
Results: We identified 3 suitable datasets: GSE16446 (n = 120; binary outcome), GSE17920 (n = 130; binary outcome), and GSE10255 (n = 161; continuous and time-to-event outcomes). The SS was statistically significantly associated with primary treatment responses for all studies (GSE16446: P = .02; GSE17920: P = .02; GSE10255: P = .02). Dichotomized SSs performed no better than chance for GSE16446 and GSE17920, and categorized SSs did not predict disease-free survival (GSE10255). SSs sometimes improved on predictions using clinical variables (GSE16446: P = .05; GSE17920: P = .31; GSE10255: P = .045), but gains were limited (95% confidence intervals for GSE16446 and GSE17920 include 0). The CS did not predict treatment response for GSE16446 (P = .55), but it did for GSE17920 (P < .001). Coefficients of clinical variables provided by MPI for CSs agree with estimates for GSE17920 better than estimates for GSE16446.
Conclusions: Model predictions were better than chance in all three datasets. However, these scores added little to existing clinical predictors; statistically significant contributions were likely to be too small to change clinical practice. These findings suggest that discovering better predictors will require both cell line data and a clinical training dataset of patient samples.
Figures
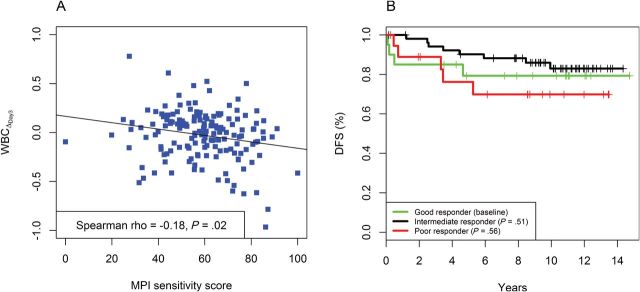
 ) and the fitted line by linear regression. B) Kaplan-Meier plots of disease-free survival (DFS) categorized by MPI sensitivity score. A good responder was a patient with top 25% sensitivity scores (n = 20). An intermediate responder was a atient with middle 50% sensitivity scores (n = 53). A poor responder was a patient with bottom 25% sensitivity scores (n = 19).
Comment in
-
Precision medicine for cancer patients: lessons learned and the path forward.J Natl Cancer Inst. 2013 Sep 4;105(17):1262-3. doi: 10.1093/jnci/djt219. Epub 2013 Aug 20. J Natl Cancer Inst. 2013. PMID: 23964132 Free PMC article. No abstract available.
References
-
- Augustine CK, Yoo JS, Potti A, et al. Genomic and molecular profiling predicts response to temozolomide in melanoma. Clin Cancer Res. 2009;15(2):502–510 - PubMed
-
- Bonnefoi H, Potti A, Delorenzi M, et al. Validation of gene signatures that predict the response of breast cancer to neoadjuvant chemotherapy: a substudy of the EORTC 10994/BIG 00-01 clinical trial. Lancet Oncol. 2007;8(12):1071–1078 - PubMed
-
- Hsu DS, Balakumaran BS, Acharya CR, et al. Pharmacogenomic strategies provide a rational approach to the treatment of cisplatin-resistant patients with advanced cancer. J Clin Oncol. 2007;25(28):4350–4357 - PubMed
-
- Potti A, Dressman HK, Bild A, et al. Genomic signatures to guide the use of chemotherapeutics. Nat Med. 2006;12(11):1294–1300 - PubMed
-
- Baggerly KA, Coombes KR. Deriving chemosensitivity from cell lines: forensic bioinformatics and reproducible research in high-throughput biology. Ann Appl Stat. 2009;3(4):1309–1334
Publication types
MeSH terms
Substances
Supplementary concepts
Associated data
- Actions
- Actions
- Actions
Grants and funding
LinkOut - more resources
Full Text Sources
Other Literature Sources
Medical
