. 2013 Aug 6:7:395.
doi: 10.3389/fnhum.2013.00395. eCollection 2013.

Traumatic brain injury, neuroimaging, and neurodegeneration

Affiliations

Traumatic brain injury, neuroimaging, and neurodegeneration

Erin D Bigler. Front Hum Neurosci. .

Abstract

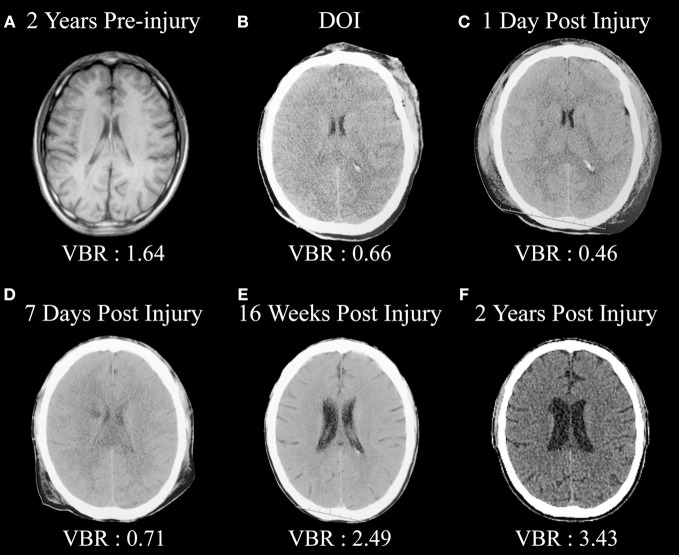
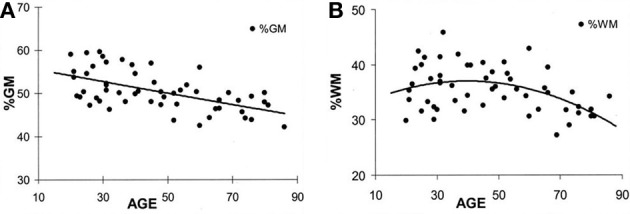
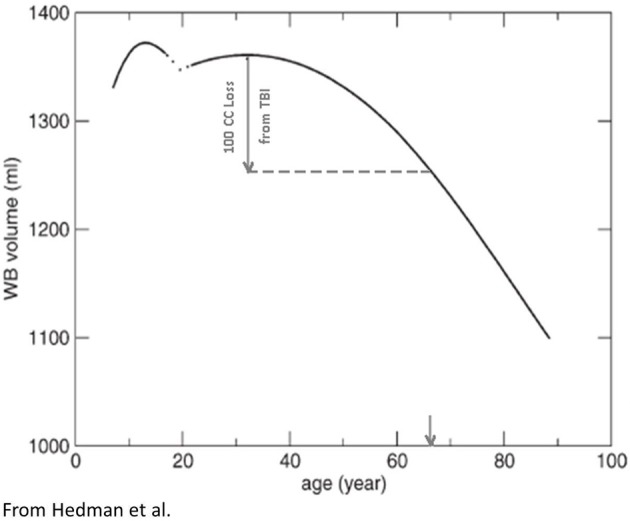
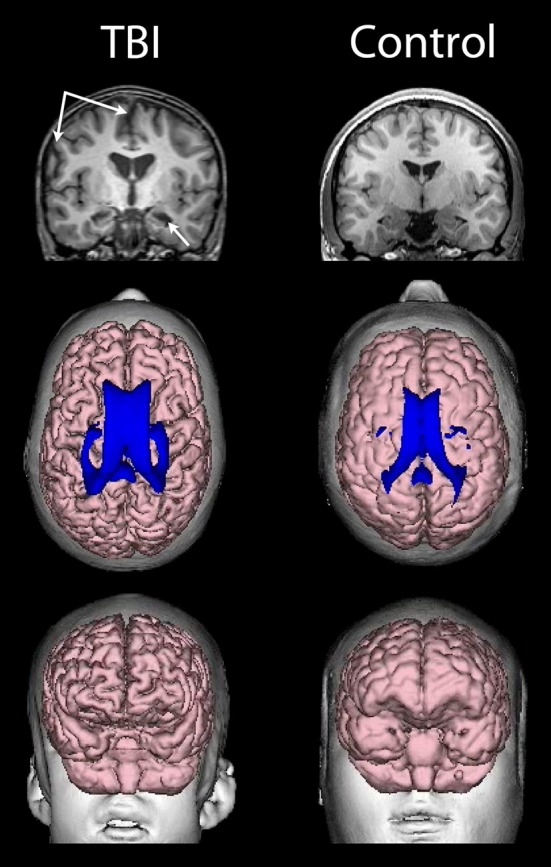
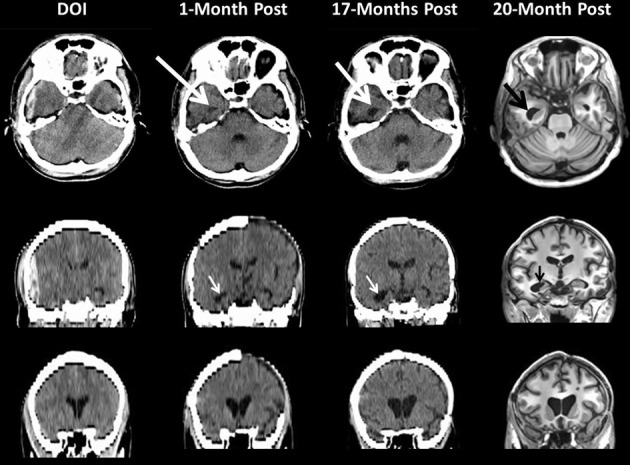
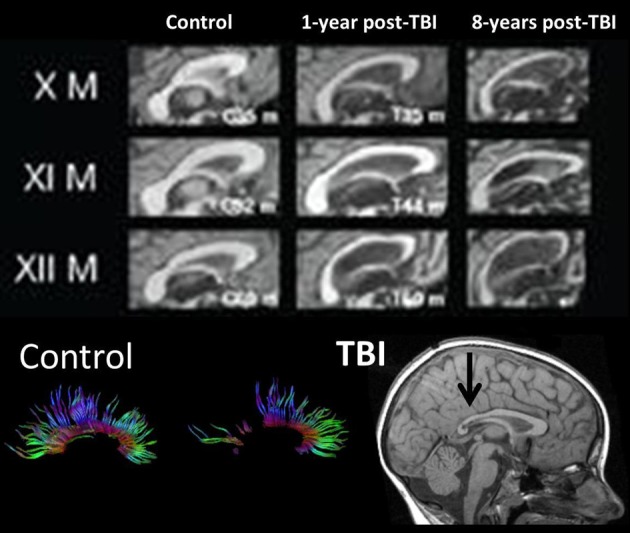
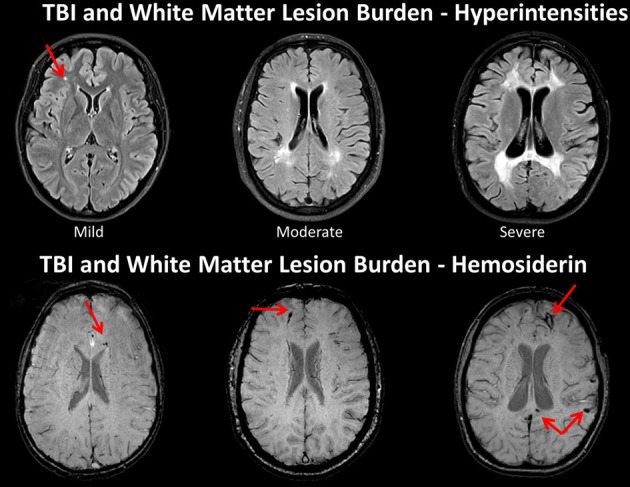
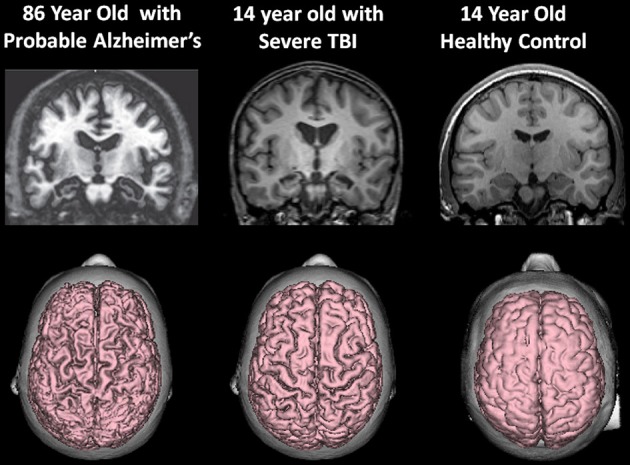
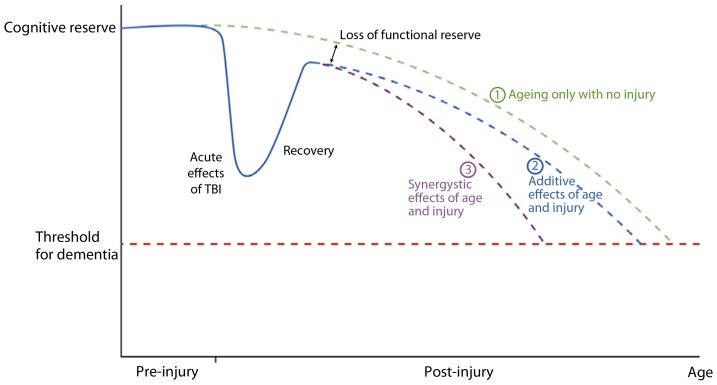
Depending on severity, traumatic brain injury (TBI) induces immediate neuropathological effects that in the mildest form may be transient but as severity increases results in neural damage and degeneration. The first phase of neural degeneration is explainable by the primary acute and secondary neuropathological effects initiated by the injury; however, neuroimaging studies demonstrate a prolonged period of pathological changes that progressively occur even during the chronic phase. This review examines how neuroimaging may be used in TBI to understand (1) the dynamic changes that occur in brain development relevant to understanding the effects of TBI and how these relate to developmental stage when the brain is injured, (2) how TBI interferes with age-typical brain development and the effects of aging thereafter, and (3) how TBI results in greater frontotemporolimbic damage, results in cerebral atrophy, and is more disruptive to white matter neural connectivity. Neuroimaging quantification in TBI demonstrates degenerative effects from brain injury over time. An adverse synergistic influence of TBI with aging may predispose the brain injured individual for the development of neuropsychiatric and neurodegenerative disorders long after surviving the brain injury.

Keywords: TBI; brain development; neurodegeneration; neuroimaging; neuropsychiatric disorders; traumatic brain injury.


Figures

Figure 1
Figure 1
(A) Pre-injury magnetic resonance image (MRI) approximately 2 years prior to a severe traumatic brain injury (TBI). Note the normal size of the ventricular system and ventricle-to-brain (VBR) ratio of 1.64 (normal is approximately 1.5 with a 0.5 standard deviation). (B) Day-of-injury initial CT demonstrating brain edema and reduced VBR, which continues to be reflected in (C,D). (E) Distinct neurodegeneration has occurred by 16 weeks post-injury, reflected as ventricular dilation and increased VBR, with continued neurodegeneration out to 2 years post-injury as seen in (F).
Figure 2
Figure 2
(A,B) These plots are from Ge et al. (2002) and reflect different trajectories of white matter (WM) and gray matter (GM) over the life-span. The percent of GM volume total brain (TBV) volume declines with age whereas the percentage of WM to TBV shows and increase followed by decline later in life. Note that the age at which an individual is injured occurs not in a static brain, but rather in a brain that has age-dependent changes occurring simultaneously with the age when injury occurs. Reproduced with permission from The American Society of Neuroradiology.
Figure 3
Figure 3
Based on a meta-analysis Hedman et al. (2011) constructed the following TBV plots over the life span from approximately age 4 through 90 years of age. A hypothetical TBI patient injured in their 20's sustaining a volume loss of a 100 cc is depicted with the inference being that although only chronologically a young adult, because of the brain loss, the total reduction of TBV is similar to someone in their 7th decade of life (downward arrow, X-axis). In other words, purely from a TBV perspective, TBI accelerated brain volume loss. Reproduced with permission from Wiley.
Figure 4
Figure 4
(Top) T1-weighted coronal images of a TBI patient on the left and an age-matched control on the right, both young adolescent males. Upper left-hand arrows point to a prominent interhemispheric fissure and cortical sulci, reflective of whole brain volume loss and generalized cerebral atrophy in the TBI patient. The lower arrow points to an atrophic hippocampus and dilated temporal horn, bilaterally in the TBI patient. (Middle) Dorsal view of a 3-D reconstruction of the ventricle in shown in blue superimposed on the flesh-tone brain surface 3-D reconstruction. Calculating whole brain volume and dividing it by total ventricular volume and multiplying by 100 results in a ventricle-to-brain ratio (VBR) of 5.55, which is markedly deviant from normal, which in typical developing controls is generally in the range of 1.5 with a 0.5 standard deviation [see Blatter et al. (1995) and Chang et al. (2005)]. The control subject VBR was 1.45. Frontal view of the 3-D reconstructed brain (Bottom) of the individual with TBI showing global frontal atrophy with visibly larger cortical sulci compared to the age-match control subject on the right, again reflective of generalized cerebral atrophy. Increased VBR reflects this type of global brain volume loss, ventricular enlargement, gyral shrinkage and sulcal enlargement.
Figure 5
Figure 5
This patient sustained a severe TBI as a consequence of a fall. Note on the day of injury (DOI) the computed tomography (CT) scan demonstrates the presence of a large epidural hematoma with brain displacement. Repeat scanning was performed at 1-month (CT scan), 17 (CT scan) and 20 months (MRI) post-injury. For the CT scans in the middle and bottom rows the coronal sections shown are based on re-sampled axial images with degradation in image resolution but sufficient to depict ventricular changes over time. Note how in the DOI scan the temporal horn is basically undetectable from parenchymal shift from the epidural as well as edema but clearly visible and dilated by 1-Month (white arrow) which increases by 17-months and even more prominent by 20 months as shown in the MRI findings. The bottom coronal images clearly depict increasing dilation of the anterior horns of the lateral ventricular system reflecting brain parenchymal volume loss that progresses from DOI through 20-months post-injury. Note at 1 month the patient still has missing bone-flap from the original craniotomy to treat a contra coup hemorrhagic contusion and subdural hematoma.
Figure 6
Figure 6
(TOP) Mid-sagittal section through the corpus callosum showing initial atrophy 1-year from TBI, but increasing atrophy within this WM structure expressed over the next 8 years, indicating late neurodegenerative effects on WM. Images reproduced with permission from Tomaiuolo et al. (2012) and Elsevier Science. (BOTTOM) Corpus callosum tractography extracted from DTI in a control, compared to a child with severe TBI. The mid-sagittal MRI shows gross thinning of the posterior corpus callosum (dark arrow) but DTI actually demonstrates that this reduced area actually has regions of no DTI-identifiable aggregate WM tracts. Adapted from Wilde et al. (2006b) used with permission from Mary Ann Liebert Publishing.
Figure 7
Figure 7
TOP: Fluid attenuated inversion recovery (FLAIR) sequence in three traumatic brain injury (TBI) cases depicting different levels of white matter burden. (Left) a child with mild TBI (mTBI) indicating a solitary, focal white matter hyperintensity (WMH). (Middle) a 62-year-old male with a severe TBI with no white matter abnormalities noted on admission CT. Patient had a GCS of 7 prior to intubation, meeting criteria for severe TBI (Right) 17-year-old injured 2 years prior with an admission GCS of 3. Note the prominent and extensive WMHs widely distributed. BOTTOM: The middle and right hand subjects are the same as above, but subject on the left side is a different child with a mild TBI, who did not have a WMH, but did show hemosiderin in the corpus callosum (arrow). Note that both patients with severe injury have some generalized atrophy and ventricular dilation as a reflection of generalized brain volume loss as a consequence of severe TBI along with multiple hemosiderin deposits.
Figure 8
Figure 8
(Top) T1-weighted coronal images approximately at the same level showing hippocampal atrophy in the 86-year-old patient with a clinical diagnosis of Alzheimer's disease and the 14-year-old patient with severe traumatic brain injury (TBI). Note compared to the control coronal image on the right, both the TBI case and the Alzheimer's exhibit hippocampal atrophy, ventricular dilation and sulcal widening. (Bottom) All images are 3-D renderings from volume acquisition magnetic resonance imaging (MRI) depicting the dorsal view of the brain in each subject described above. Note the similarity of the diffuse pattern of atrophic change that has occurred in both the patient with Alzheimer's disease and the adolescent who survived severe TBI. Clearly, the elderly patient with Alzheimer's has more severe atrophy but nonetheless the atrophy in the TBI adolescent is substantial, especially when compared to the typical developing adolescent control. Note: The patient with Alzheimer's disease is taken from Jacobson et al. (2009); this patient's clinical findings, including additional neuroimaging and neuropsychological details are described in that publication. Reproduced with permission from John Wiley and Sons.
Figure 9
Figure 9
A graphical representation of a postulated cognitive reserve and how head injury may increase the risk of cognitive decline. The broken green line (1) represents the “normal” situation. There is loss of cognitive function with aging until a threshold point is crossed (broken red line) resulting clinically in dementia. After an episode of traumatic brain injury there is a significant decline in cognitive function which recovers, the degree of recovery being dependent on the severity of the head injury. Recovery is, however, not complete resulting in a loss of functional reserve. After this point cognitive decline may be as for normal ageing [broken blue line (2)] with the dementia threshold being crossed earlier due to loss of functional reserve, or there may be a continued synergistic effect of mechanisms initiated by the head injury which accelerates cognitive decline [broken purple line (3)]. Reproduced with permission from John Wiley and Sons and Smith (2013).

References

    1. Adams J. H., Jennett B., Murray L. S., Teasdale G. M., Gennarelli T. A., Graham D. I. (2011). Neuropathological findings in disabled survivors of a head injury. J. Neurotrauma 28, 701–709 10.1089/neu.2010.1733 - DOI - PubMed
    1. American Psychiatric Association. (2013). Diagnostic and Statistical Manual of Mental Disorders (DSM-5), 5th Edn. Washington, DC: American Psychiatric Publishing
    1. Amor S., Puentes F., Baker D., van der Valk P. (2010). Inflammation in neurodegenerative diseases. Immunology 129, 154–169 10.1111/j.1365-2567.2009.03225.x - DOI - PMC - PubMed
    1. Aoki Y., Inokuchi R., Gunshin M., Yahagi N., Suwa H. (2012). Diffusion tensor imaging studies of mild traumatic brain injury: a meta-analysis. J. Neurol. Neurosurg. Psychiatry 83, 870–876 10.1136/jnnp-2012-302742 - DOI - PMC - PubMed
    1. Apostolova L. G., Green A. E., Babakchanian S., Hwang K. S., Chou Y. Y., Toga A. W., et al. (2012). Hippocampal atrophy and ventricular enlargement in normal aging, mild cognitive impairment (MCI), and Alzheimer disease. Alzheimer Dis. Assoc. Disord. 26, 17–27 10.1097/WAD.0b013e3182163b62 - DOI - PMC - PubMed

LinkOut - more resources