. 2013 Aug 13:7:15.
doi: 10.3389/fninf.2013.00015. eCollection 2013.

Fully automated rodent brain MR image processing pipeline on a Midas server: from acquired images to region-based statistics

Affiliations

Fully automated rodent brain MR image processing pipeline on a Midas server: from acquired images to region-based statistics

Francois Budin et al. Front Neuroinform. .

Abstract

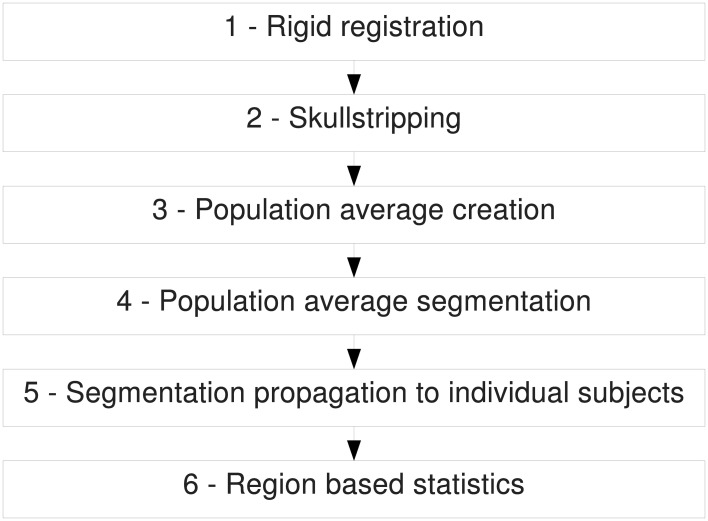
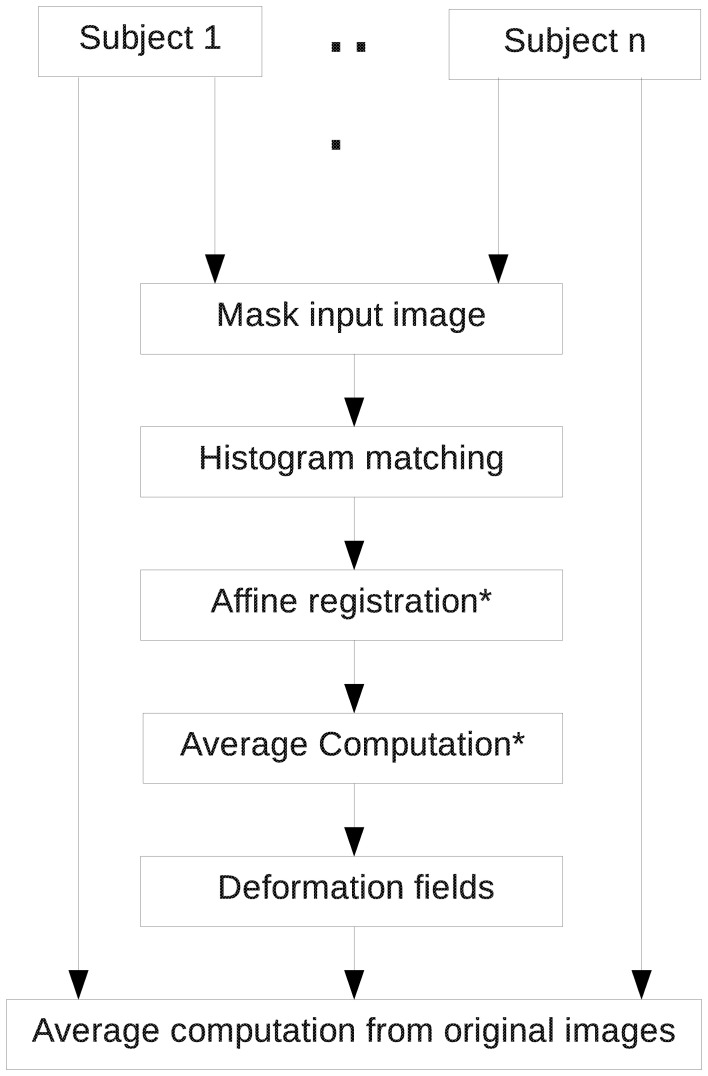
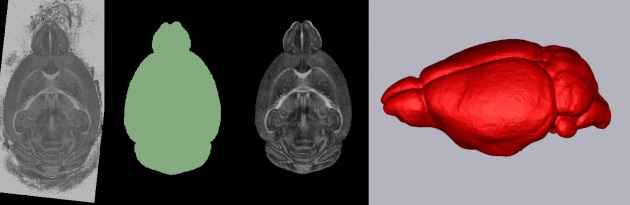
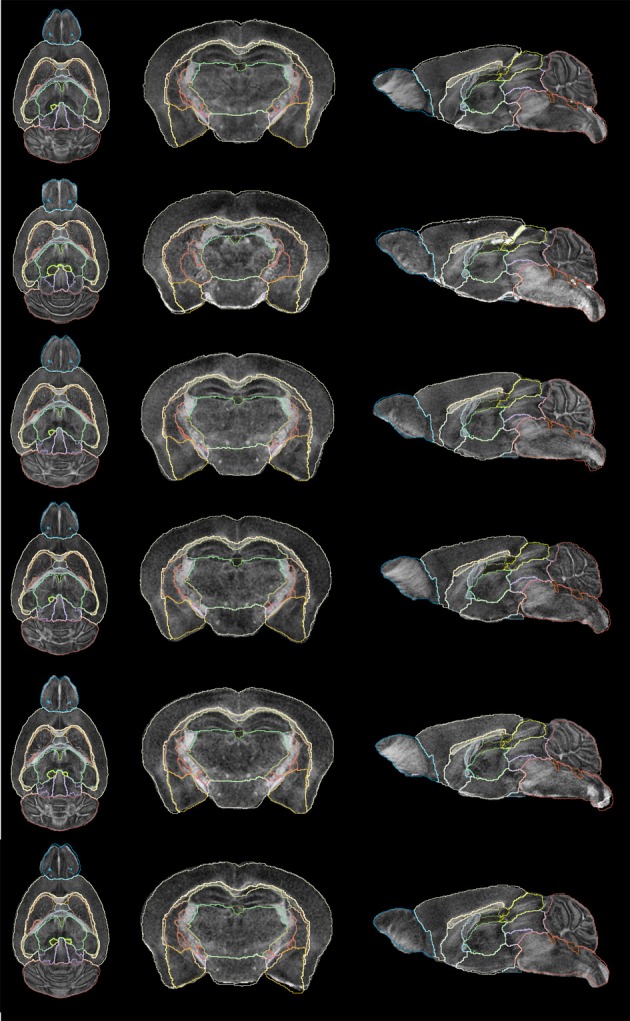
Magnetic resonance imaging (MRI) of rodent brains enables study of the development and the integrity of the brain under certain conditions (alcohol, drugs etc.). However, these images are difficult to analyze for biomedical researchers with limited image processing experience. In this paper we present an image processing pipeline running on a Midas server, a web-based data storage system. It is composed of the following steps: rigid registration, skull-stripping, average computation, average parcellation, parcellation propagation to individual subjects, and computation of region-based statistics on each image. The pipeline is easy to configure and requires very little image processing knowledge. We present results obtained by processing a data set using this pipeline and demonstrate how this pipeline can be used to find differences between populations.

Keywords: automatic processing; magnetic resonance imaging; rodent; server.


Figures

Figure 1
Figure 1
Screenshots presenting the user interface of the pipeline when running the registration step. From top to bottom: selection of the images to register, selection of the fixed image for the registration, selection of the options including the type of the input image.
Figure 2
Figure 2
Overview of the entire pipeline.
Figure 3
Figure 3
Rigid registration pipeline. Registration is performed using RegisterImages, a tool distributed with 3D Slicer.
Figure 4
Figure 4
Skull-stripping pipeline. Registrations are performed using RegisterImages and Expectation Maximization Segmentation (EMS) is computed with Atlas Based Classification (ABC). Both tools are available in 3D Slicer.
Figure 5
Figure 5
Population average computation pipeline. Registration is performed using RegisterImages (distributed with 3D Slicer) and Average Computation is done with AtlasWerks.
Figure 6
Figure 6
Rigid registration pipeline. The DWI scan is registered to a template and derived images (MD, FA, b = 0, iDWI, color-coded FA) are computed.
Figure 7
Figure 7
Skull-stripping pipeline. From left to right: original FA image, computed mask, original FA image skull-stripped, 3D rendering of computed mask.
Figure 8
Figure 8
Population average computation pipeline output. From top to bottom: sagittal view, axial view, coronal view. From left to right: RD image, MD image, AD image, FA image, color-coded FA with ellipsoids representing the tensors superimposed.
Figure 9
Figure 9
Regional segmentation of the population average FA image. From left to right: Axial view, coronal view, sagittal view. The list of the different regions is: Hippocampus, Corpus Callosum and External capsule, Caudate and Putamen, Anterior commissure, Globus Pallidus, Internal capsule, Thalamus, Cerebellum, Superior Colliculi, Ventricle, Hypothalamus, Inferior colliculi, Central Gray, Neocortex, Amygdala, Olfactory Bulb, Brain Stem, Rest of Midbrain, Basal Fore Brain and Septum, Fimbria, Pituitary.
Figure 10
Figure 10
3D rendering of the population average segmentation. Cerebellum, neocortex, corpus callosum and external capsule were made partially see-through to allow better visualization of the inside regions.
Figure 11
Figure 11
Subject segmentation. From left to right: axial view, coronal view and sagittal view of cases 1–6 (bottom–top).
Figure 12
Figure 12
Distribution of the segmented brain region volumes (mm3). Neocortex volume is not presented for scale difference reason. Median: bar band; 25th and 75th percentile: left and right bar respectively; minimum and maximum: whiskers.
Figure 13
Figure 13
Axial diffusivity (mm2/s) of the segmented brain regions. Median: bar band; 25th and 75th percentile: left and right bar respectively; minimum and maximum: whiskers.

References

    1. Arsigny V., Fillard P., Pennec X., Ayache N. (2010). Log-Euclidean metrics for fast and simple calculus on diffusion tensors. Magn. Reson. Med. 56, 411–421 10.1002/mrm.20965 - DOI - PubMed
    1. Asanuma T., Doblas S., Tesiram Y. A., Saunders D., Cranford R., Yasui H., et al. (2008). Visualization of the protective ability of a free radical trapping compound against rat c6 and f98 gliomas with diffusion tensor fiber tractography. J. Magn. Reson. Imaging 28, 574–587 10.1002/jmri.21474 - DOI - PubMed
    1. Avants B. B., Epstein C. L., Grossman M., Gee J. C. (2008). Symmetric diffeomorphic image registration with cross-correlation: evaluating automated labeling of elderly and neurodegenerative brain. Med. Image Anal. 12, 26–41 10.1016/j.media.2007.06.004 - DOI - PMC - PubMed
    1. Badea A., Ali-Sharief A. A., Johson G. A. (2007). Morphometric analysis of the C57BL/6J mouse brain. Neuroimage 37, 683–693 10.1016/j.neuroimage.2007.05.046 - DOI - PMC - PubMed
    1. Badea A., Gewalt S., Avants B. B., Cook J. J., Johnson G. A. (2012). Quantitative mouse brain phenotyping based on single and multispectral MR protocols. Neuroimage 63, 1633–1645 - PMC - PubMed

LinkOut - more resources