. 2013 Aug 12:4:493.
doi: 10.3389/fpsyg.2013.00493. eCollection 2013.

fMRI orientation decoding in V1 does not require global maps or globally coherent orientation stimuli

Affiliations

fMRI orientation decoding in V1 does not require global maps or globally coherent orientation stimuli

Arjen Alink et al. Front Psychol. .

Abstract

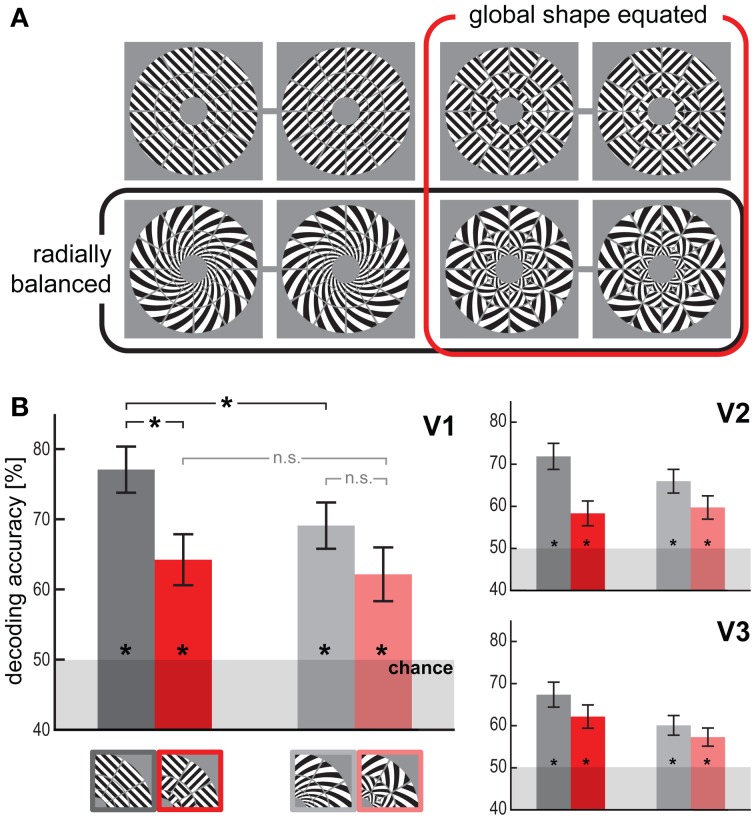
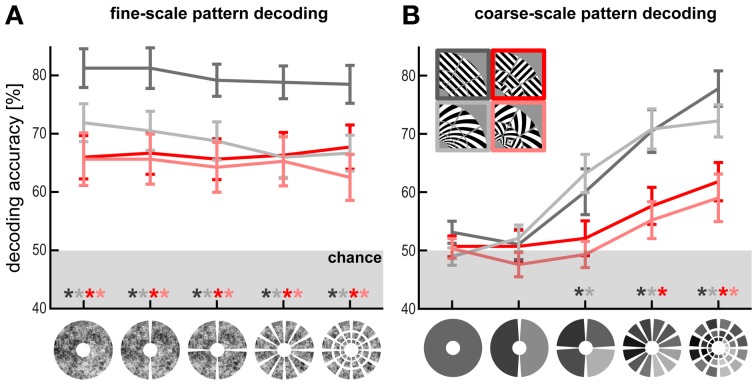
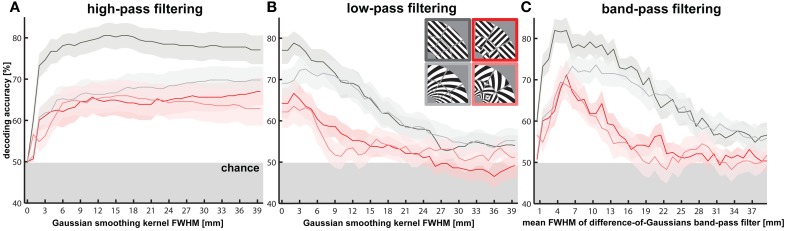
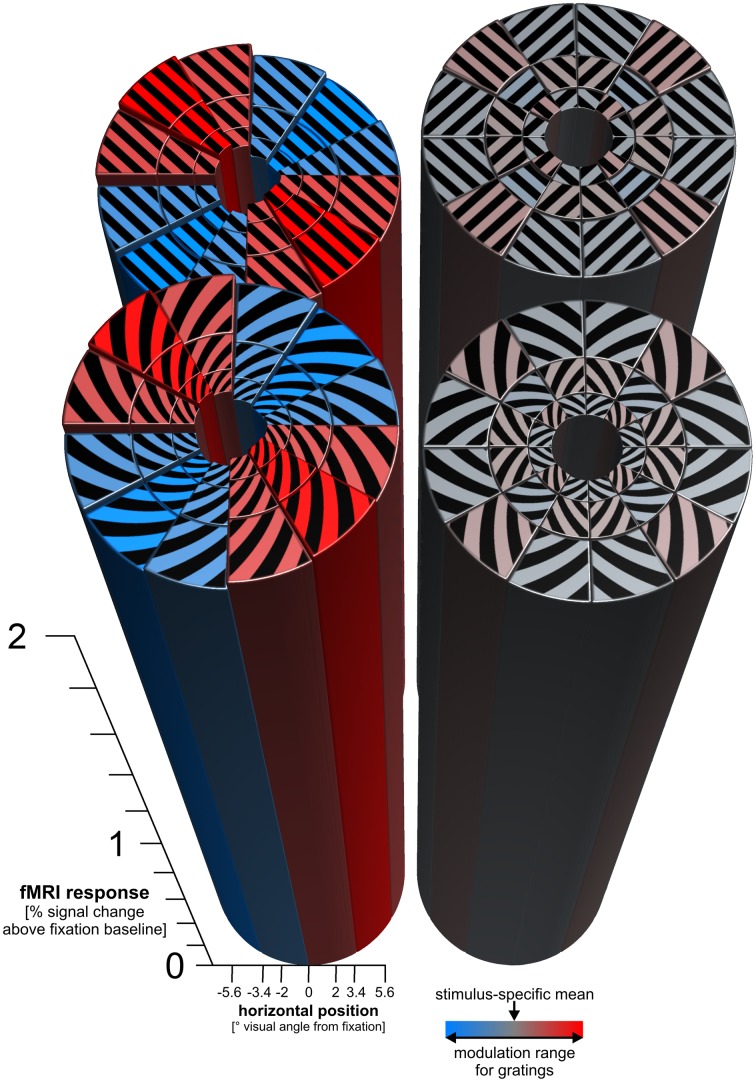
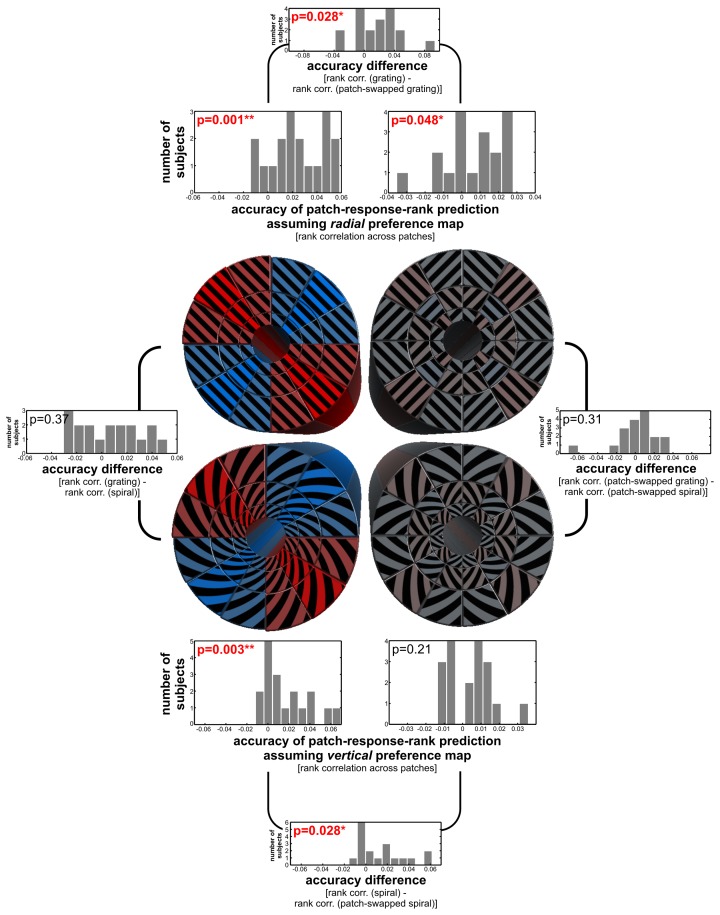
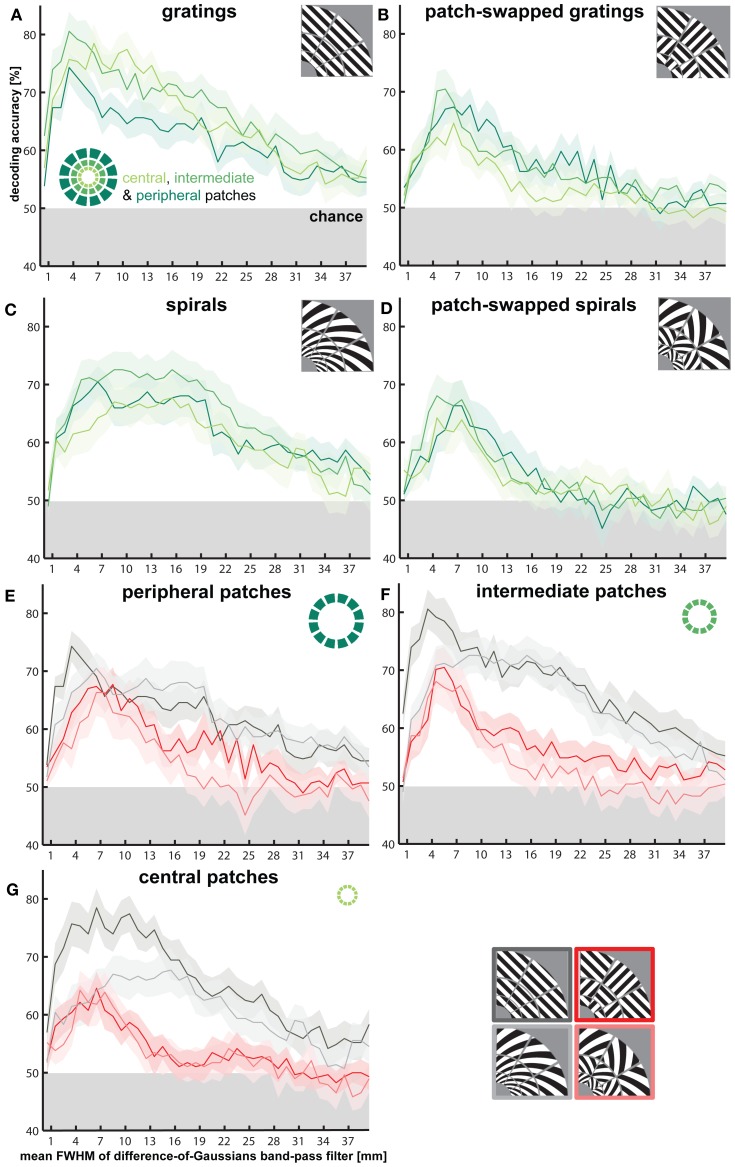
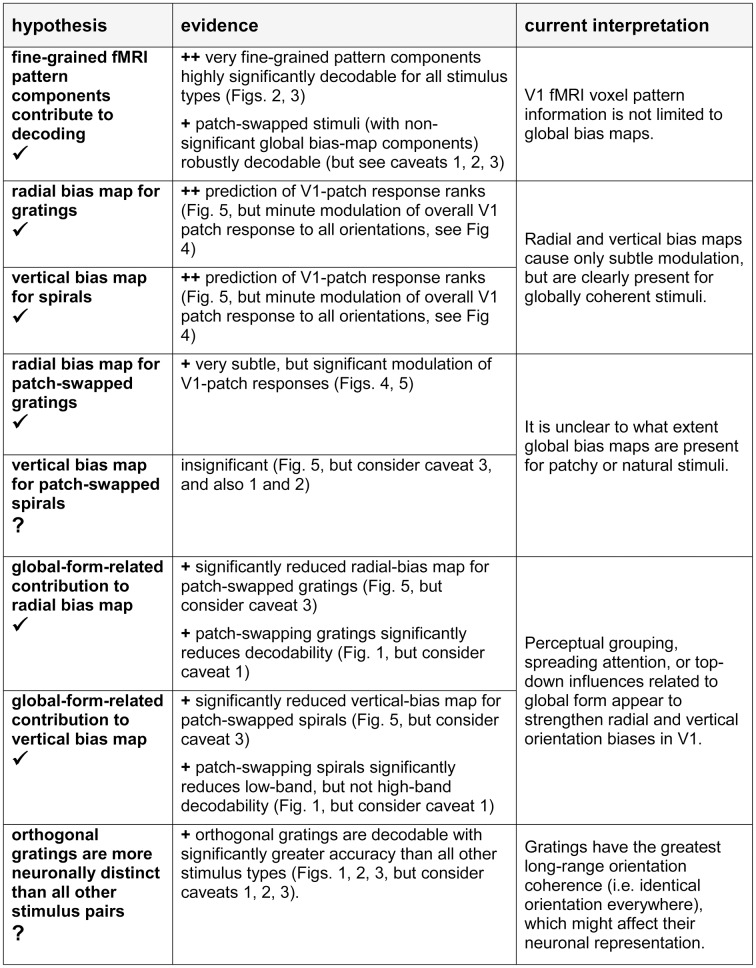
The orientation of a large grating can be decoded from V1 functional magnetic resonance imaging (fMRI) data, even at low resolution (3-mm isotropic voxels). This finding has suggested that columnar-level neuronal information might be accessible to fMRI at 3T. However, orientation decodability might alternatively arise from global orientation-preference maps. Such global maps across V1 could result from bottom-up processing, if the preferences of V1 neurons were biased toward particular orientations (e.g., radial from fixation, or cardinal, i.e., vertical or horizontal). Global maps could also arise from local recurrent or top-down processing, reflecting pre-attentive perceptual grouping, attention spreading, or predictive coding of global form. Here we investigate whether fMRI orientation decoding with 2-mm voxels requires (a) globally coherent orientation stimuli and/or (b) global-scale patterns of V1 activity. We used opposite-orientation gratings (balanced about the cardinal orientations) and spirals (balanced about the radial orientation), along with novel patch-swapped variants of these stimuli. The two stimuli of a patch-swapped pair have opposite orientations everywhere (like their globally coherent parent stimuli). However, the two stimuli appear globally similar, a patchwork of opposite orientations. We find that all stimulus pairs are robustly decodable, demonstrating that fMRI orientation decoding does not require globally coherent orientation stimuli. Furthermore, decoding remained robust after spatial high-pass filtering for all stimuli, showing that fine-grained components of the fMRI patterns reflect visual orientations. Consistent with previous studies, we found evidence for global radial and vertical preference maps in V1. However, these were weak or absent for patch-swapped stimuli, suggesting that global preference maps depend on globally coherent orientations and might arise through recurrent or top-down processes related to the perception of global form.

Keywords: decoding; fMRI; global form; hyperacuity; orientation selectivity; pattern analysis; radial bias; visual cortex.


Figures

Figure 1
Figure 1
Visual orientations are robustly decodable for all stimulus types. (A) The four stimulus types, uniform gratings (upper left pair), spirals (lower left pair), patch-swapped gratings (upper right pair), and patch-swapped spirals (lower right pair). For each type we presented two differently oriented exemplars (pairing indicated by gray lines) with a 90-deg orientation disparity at every location. Stimuli were presented centered on fixation. The retinal diameter of each stimulus was 14.08° (inner-border radius: 1.5°, outer-border radius: 7.04°). (B) Orientation decoding accuracy (linear SVM, leave-one-subrun-out cross-validation) for each stimulus type and visual area (V1-3). Error bars indicate the standard error of the mean across all 18 subjects. Asterisks on bars indicate that decoding accuracy was significantly above chance level (p < 0.01). Asterisks on horizontal brackets indicate significant differences (p < 0.05) between decoding accuracies.
Figure 2
Figure 2
Fine- and coarse-scale pattern components enable orientation decoding. (A) Fine-scale pattern decoding. V1 decoding accuracy after subtracting out patch-average activation levels (i.e., removing the spatial low-frequency component) from the patterns at different scales. Patch sizes, from coarse to fine (left to right): full-field representation (1 patch), hemifield representations (2 patches), quarterfield representations (4 patches), 30° radial-wedge representations (12 patches), and each radial wedge divided further into three equally sized cortical patches representing different eccentricities (36 patches). (B) Coarse-scale pattern decoding. V1 decoding accuracy based on only the patch averages using the same patch scheme.
Figure 3
Figure 3
Effects of spatial high-, low- and band-pass filtering of V1 activity patterns on orientation decodability. Orientation decodability and SEM (shaded area) is plotted for different levels of spatial (A) high- and (B) low-pass filtering of V1 activity patterns using a three dimensional Gaussian kernel with a full width at half maximum (FWHM) ranging from 1 to 40 mm in steps of 1 mm. (C) Orientation decodability is plotted after spatial band-pass filtering of V1 activity patterns using a bandwidth of 1 mm (difference of FWHMs for difference-of-Gaussians filter) and FWHMs from 1 to 40 mm. As a reference, the size of the stimulated area of V1—defined as the largest voxel-to-voxel distance within the region—was on average 43.7 mm (SD = 5.9 mm).
Figure 4
Figure 4
Radial and vertical preference maps. The figure shows the response predictions of cosine-tuning models of radial and cardinal preference. For each log-polar patch of a stimulus, a bar shows the response of the V1 region representing that patch. Each patch responds strongly to each stimulus (overall height of the bars > 2% signal change). On top of the strong overall response, there is a subtle modulation consistent with a global radial preference for gratings (± 0.025% signal change). There is a similar subtle modulation consistent with a vertical preference map for spirals (± 0.021% signal change). For patch-swapped stimuli, these modulations were much smaller (± 0.0028% signal change for patch-swapped gratings, ± 0.0018% signal change for patch-swapped spirals). These effect sizes are amplitude parameter estimates of cosine-tuning models (see Methods), averaged across all 18 participants. For inference on these effects, see Figure 5.
Figure 5
Figure 5
Statistical inference for radial and vertical preference maps and preference differences. Inference is based on the accuracy with which the radial/tangential or vertical/horizontal preference model predicts the rank order of response amplitudes across patches (see Methods). The histograms show the distribution across subjects of these accuracies (Spearman r). We performed a two-sided Wilcoxon signed-rank test on each accuracy distribution. The p-value for each effect is in the top left corner of the corresponding histogram and in bold red if it indicates a significant effect. The outer plots show differences between stimulus types in the strength of radial and vertical preference effects, and their p-values from the same two-sided signed-rank test.
Figure 6
Figure 6
Impact of head motion on orientation decodability. (A) The correlation between a head motion index—reflecting the average translation and rotation changes per volume/2 s—and average orientation classification performance (averaged across all stimulus types) across participants. There are 17 data points because we excluded one participant whose average head motion was more than three standard deviations greater than the group average. (B) Pearson correlation coefficients and (C) p-values for the correlation between head motion and decoding performance based on activity patterns that were band-pass filtered at spatial frequencies ranging from 1 to 40 mm.
Figure 7
Figure 7
Effects of stimulus type, eccentricity, and polar angle on average V1 responses. (A) Spatial-mean V1 activation for each stimulus type and orientation. (B) V1 response for each of the three patch eccentricities. (C) V1 responses for each of the 12 polar angles. Responses are averaged across the remaining variables (stimulus type, V1 patches, participants). Error bars indicate the SEM computed across participants. Gray lines depict each individual participant's responses.
Figure 8
Figure 8
Effects of V1 patch eccentricity on orientation decodability. Same band-pass filtering approach as for Figure 3C, but plotted separately for patterns in the central, intermediate, and peripheral ring of V1 patches. (A–D) highlight differences in orientation decodability between rings, depicted for each stimulus type separately. (E–G) highlight differences in orientation decodability between stimulus types, depicted for each ring separately.
Figure 9
Figure 9
Hypotheses, evidence from this study, and our current interpretation. In the hypothesis column, a checkmark indicates the presence of significant evidence in favor of the hypothesis; a question mark indicates that the evidence is weak or absent. In the evidence column, ++ indicates strong evidence, + indicates evidence to be considered in the light of potential caveats. Caveats: (1) Imprecise fixation may have blurred the V1-patch checkerboard entailing greater reduction of decoding contrast for patch-swapped than for globally coherent stimuli. (2) Imprecise fixation may also have added noise to the local orientation signal for all stimuli, except gratings. However, our task required continual fixation to discern tiny foveal cues. Successful performance suggests that lapses of fixation were minimal. (3) Imprecision in V1 patch definitions might have led to reduced patch contrast for patch-swapped stimuli, where the preference predicted by the global map inverts for adjacent patches. However, a control analysis (see Results, Discussion) did not support this account.

References

    1. Boynton G. M., Engel S. A., Glover G. H., Heeger D. J. (1996). Linear systems analysis of functional magnetic resonance imaging in human V1. J. Neurosci. 16, 4207–4221 - PMC - PubMed
    1. Chang C. C., Lin C. J. (2011). LIBSVM: A Library for Support Vector Machines. ACM Transactions on Intelligent Systems and Technology (TIST). (New York, NY: Thieme Medical Publishers; ), 10.1145/1961189.1961199 - DOI
    1. Clifford C. W. G., Mannion D., Seymour K., McDonald J., Bartels A. (2011). Are Coarse-Scale Orientation Maps Really Necessary for Orientation Decoding? Available online at: http://www.jneurosci.org/content/31/13/4792/reply
    1. Freeman J., Brouwer G. J., Heeger D. J., Merriam E. P. (2011). Orientation decoding depends on maps, not columns. J. Neurosci. 31, 4792–4804 10.1523/JNEUROSCI.5160-10.2011 - DOI - PMC - PubMed
    1. Furmanski C. S., Engel S. A. (2000). An oblique effect in human primary visual cortex. Nat. Neurosci. 3, 535–536 10.1038/75702 - DOI - PubMed

LinkOut - more resources