. 2013 Aug 22:13:333.
doi: 10.1186/1472-6963-13-333.

Regional health care planning: a methodology to cluster facilities using community utilization patterns

Affiliations

Regional health care planning: a methodology to cluster facilities using community utilization patterns

Paul L Delamater et al. BMC Health Serv Res. .

Abstract

Background: Community-based health care planning and regulation necessitates grouping facilities and areal units into regions of similar health care use. Limited research has explored the methodologies used in creating these regions. We offer a new methodology that clusters facilities based on similarities in patient utilization patterns and geographic location. Our case study focused on Hospital Groups in Michigan, the allocation units used for predicting future inpatient hospital bed demand in the state's Bed Need Methodology. The scientific, practical, and political concerns that were considered throughout the formulation and development of the methodology are detailed.

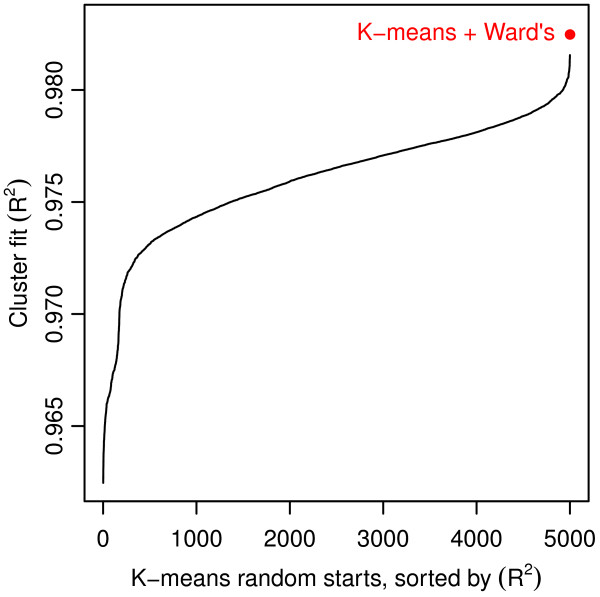
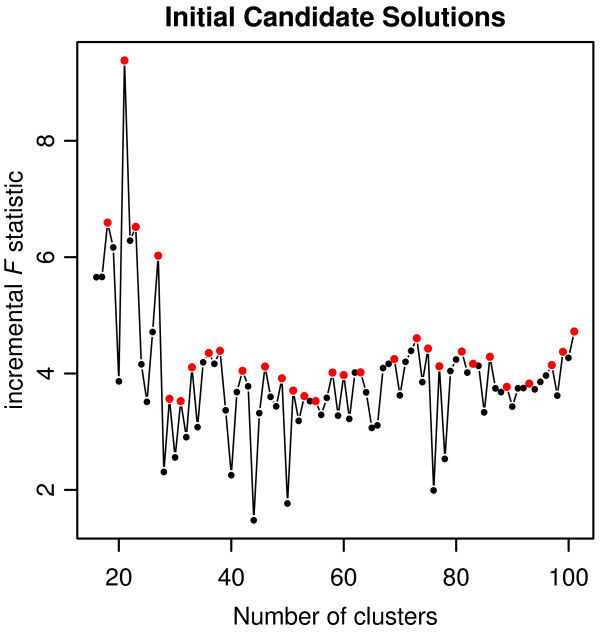
Methods: The clustering methodology employs a 2-step K-means + Ward's clustering algorithm to group hospitals. The final number of clusters is selected using a heuristic that integrates both a statistical-based measure of cluster fit and characteristics of the resulting Hospital Groups.

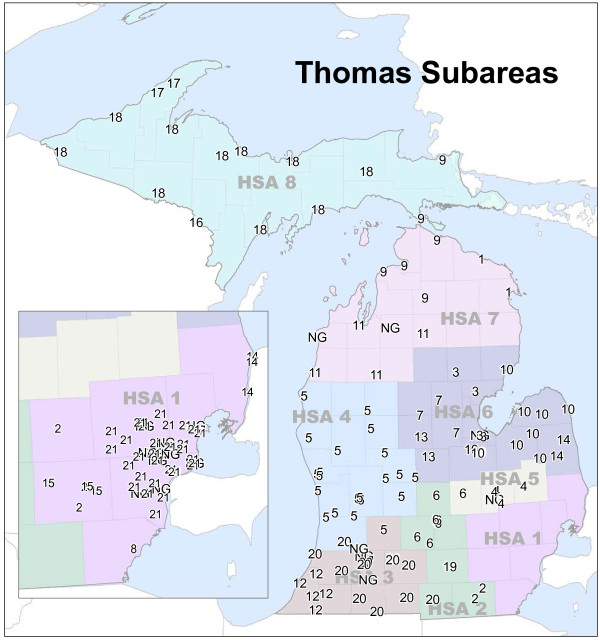
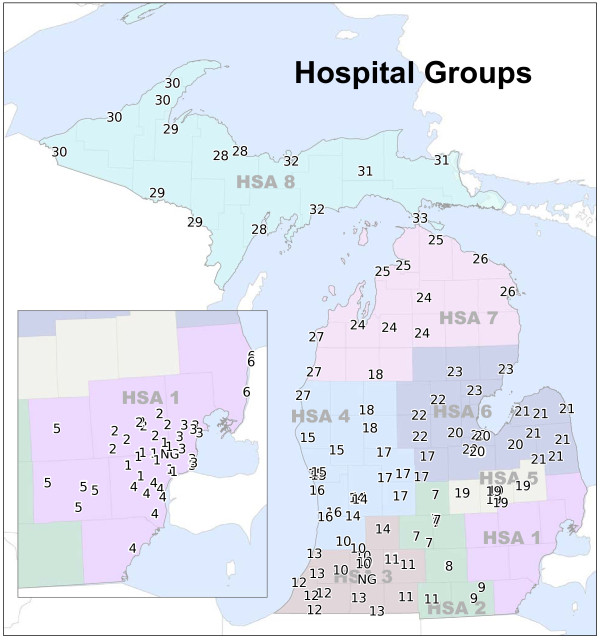
Results: Using recent hospital utilization data, the clustering methodology identified 33 Hospital Groups in Michigan.

Conclusions: Despite being developed within the politically charged climate of Certificate of Need regulation, we have provided an objective, replicable, and sustainable methodology to create Hospital Groups. Because the methodology is built upon theoretically sound principles of clustering analysis and health care service utilization, it is highly transferable across applications and suitable for grouping facilities or areal units.


Figures

Figure 1
Figure 1
Michigan’s current subareas. Labels indicate hospital location and Subarea membership. Underlying colors represent Michigan’s Health Service Areas (HSAs).
Figure 2
Figure 2
Changes in travel time behavior for hospitalizations (2000-2010). (L) Travel time is the number of minutes between the patient’s residence and the hospital. Cumulative probability is the proportion of patient days utilized at hospitals greater than or equal to the specific travel time. For example, the cumulative probability at 0 minutes is equal to 1 because all hospitalizations occurred at a hospital located 0 minutes or more from the patient’s residence. In another example, the percentage of patient days at hospitals 30 minutes or further from the patient’s residence is roughly 20% in 2010 and roughly 17.5% in 2000. (R) Yearly values of cumulative probability for 20, 30, and 40 minutes are shown.
Figure 3
Figure 3
Subareas produced by the Thomas Methodology using current data. 34 hospitals did not possess the required minimum home area to be included in the Thomas Methodology. Because no details are provided by the methodology with regards to handling these cases, they were removed from the clustering process. They have been assigned NG (non-groupable) for display purposes.
Figure 4
Figure 4
RI and CI maps for two hospitals of different sizes. Hospital #1 has roughly 5 times more licensed inpatient beds than Hospital #2. The hospitals are located within one mile from one another. The classification schemes for RI and CI values are held constant between maps for comparative purposes.
Figure 5
Figure 5
RI and CI values two hospitals of different sizes. CI values (L) and RI values (R) are plotted for the two hospitals across areal units (e.g., Hospital #1’s RI in Areal Unit #1 plotted against Hospital #2’s RI in Areal Unit #1). A 1:1 line has been added for reference.
Figure 6
Figure 6
Local minima and random starting locations with the K-means algorithm. 5,000 K-means model runs for K = 50 produced 5,000 unique cluster solutions (black line). A single model run of the K-means + Ward’s algorithm provided another unique cluster solution with a better fit (red point) than any of the 5,000 stand-alone K-means solutions.
Figure 7
Figure 7
Initial candidate solutions for Hospital Groups. Data are truncated for display purposes. Red points represent local maxima in incF values.
Figure 8
Figure 8
Hospital Groups created using new clustering methodology.

References

    1. Ferrier G, Leleu H, Valdmanis V. The impact of CON regulation on hospital efficiency. Health Care Manag Sci. 2010;13:84–100. doi: 10.1007/s10729-009-9113-z. - DOI - PubMed
    1. US Federal Trade Commission and US Department of Justice. Improving Health Care: A Dose of Competition. Washington, D.C: Tech. rep., US, Government Printing Office; 2004.
    1. Rivers PA, Fottler MD, Younis MZ. Does certificate of need really contain hospital costs in the United States? Health Edu J. 2007;66(3):229–244. doi: 10.1177/0017896907080127. - DOI
    1. National Conference of State Legislatures. CON-certificate of need state laws. 2011. [ http://www.ncsl.org/issues-research/health/con-certificate-of-need-state...]
    1. Bay KS, Nestman LJ. The use of bed distribution and service population indexes for hospital bed allocation. Health Serv Res. 1984;19(2):141–160. - PMC - PubMed

Publication types

MeSH terms