. 2013 Sep;5(9):782-9.
doi: 10.1038/nchem.1713. Epub 2013 Jul 28.

Conditionally fluorescent molecular probes for detecting single base changes in double-stranded DNA

Affiliations

Conditionally fluorescent molecular probes for detecting single base changes in double-stranded DNA

Sherry Xi Chen et al. Nat Chem. 2013 Sep.

Abstract

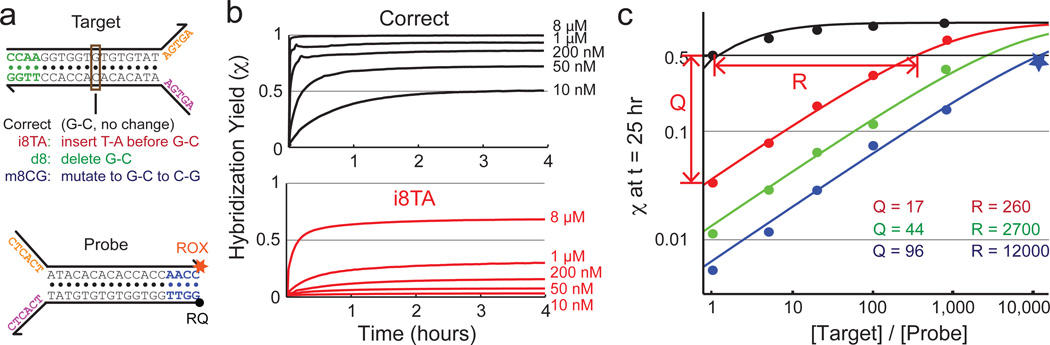
Small variations in nucleic acid sequences can have far-reaching phenotypic consequences. Reliably distinguishing closely related sequences is therefore important for research and clinical applications. Here, we demonstrate that conditionally fluorescent DNA probes are capable of distinguishing variations of a single base in a stretch of target DNA. These probes use a novel programmable mechanism in which each single nucleotide polymorphism generates two thermodynamically destabilizing mismatch bubbles rather than the single mismatch formed during typical hybridization-based assays. Up to a 12,000-fold excess of a target that contains a single nucleotide polymorphism is required to generate the same fluorescence as one equivalent of the intended target, and detection works reliably over a wide range of conditions. Using these probes we detected point mutations in a 198 base-pair subsequence of the Escherichia coli rpoB gene. That our probes are constructed from multiple oligonucleotides circumvents synthesis limitations and enables long continuous DNA sequences to be probed.


Figures

FIG. 1
FIG. 1
Schematic representation of the double-stranded toehold exchange mechanism (a) The reaction starts with the hybridization of the initiation toeholds (orange and purple), forming a four-stranded complex C0. Next, the four-stranded complex undergoes a series of single-base reconfiguration events known as branch migration [23]. The various states of branch migration (Ci) are roughly isoenergetic, and thus each branch migration step is reversible and unbiased. When the branch migration reaches state Cn where the four-stranded complex is held together only by the dissociation toeholds (blue and green), these dissociation toeholds can spontaneously dissociate to release the two product molecules. (b) A highly specific, conditionally fluorescent molecular probe based on four-stranded toehold exchange. The probe is functionalized at the balancing toeholds with a fluorophore and a quencher on separate strands; at the end of the reaction, the fluorophore is delocalized from the quencher and fluorescence increases. The lengths and sequences of the toeholds are designed so that the ΔGintended˚ of reaction between the probe and the intended target is roughly 0. The reaction between the probe and the SNP target will result in two mismatch bubbles, and the reaction ΔGSNP˚ will be about 8 kcal/mol. (c) Plot of the analytic hybridization yield (χ) at equilibrium of the A+BD+E reaction against the reaction ΔG˚ (assuming that identical initial concentrations of A and B). Designing ΔGintended˚0 ensures a balance of high specificity and high yield.
FIG. 2
FIG. 2
Discrimination of SNPs by the dsDNA probe. (a) Sequence of the intended target and the positions/identities of base pair changes that lead to the 14 SNP targets. Circled 1, 2, and 3 denote the positions of the mismatch. Mismatches, insertions, and deletions are respectively shown in blue, red, and green. (b) Hybridization yield, as inferred from fluorescence kinetics (see Fig. S1 and Methods). The probe is present in solution initially, and the intended or SNP target is introduced at t ≈ 0. Experiments were run at 25 °C in 1 M Na+. The trace for intended target is shown in black, and traces for SNP targets are shown in the colors described above (see Fig. S2 for zoom-in of SNP reactions). (c) Reactions equilibration appears to be complete after 4 hours; to ensure equilibration, however, the reactions were allowed to proceed until t = 25 hr. The hybridization yields at t = 25 hr are taken to be the equilibrium values, and discrimination factors Q=χintendedχSNP are calculated for each SNP target. Observed Q values range between 17 and 99 (median = 43). Error bars show standard deviations calculated from three repetitions of each experiment.
FIG. 3
FIG. 3
Analysis and measurement of the concentration of SNP target needed to generate the same hybridization yield as a stoichiometric (relative to probe) amount of intended target (concentration equivalence R). (a) Sequences of intended and SNP targets used for experiments in this figure. (b) Hybridization yields (χ) of various concentrations of intended and “i8TA” SNP target. In all traces, initial probe concentration [B]0 = 10 nM. (c) Hybridization yields plotted against the stoichiometric ratio of the target. As with previous experiments, the hybridization yield was inferred from fluorescence value at t = 25 hr. Experimentally determined values are shown as dots and star, and solid lines show the analytic model prediction based on best-fit ΔG˚ values (Text S1). All experiments other than the star data point were performed with 10 nM probe; the star data point reaction was performed with 2 nM probe to conserve reagents. Concentration equivalence R values are calculated based on best-fit models at 5% hybridization yield, and ranges between 260 and 12,000. Analysis shows and experiments verify that RQ2, with Q=χindentedχSNP being the discrimination factor.
FIG. 4
FIG. 4
Characterization of the background, temperature, salinity, and time robustness of the probe. The probe operates robustly to discriminate SNPs (a) in the presence of high concentrations of 50 nt polyN strands, (b) in different salinity buffers, and (c) at different temperatures (see also Fig. S5 and S6). (d) The discrimination factor Q approaches its final value after about 10 minutes of reaction, and maintains high discrimination indefinitely. The initial rise and bumpiness in Q can be attributed to fluorescence signal instability directly following addition of target to solution (see Fig. S2).
FIG. 5
FIG. 5
Detection of SNPs in E. coli-derived samples. (a) Rifampicin resistance is typically confered by mutations in one of two regions in the rpoB gene, nucleotides 1531–1599 and 1684–1728, corresponding to amino acid residues 511–533 and 562–576. Here, we generated three distinct probes, one to test each region, and one to test both simultaneously. See Fig. S17 for sequences of probes and targets. (b) DNA from ten rifampicin-resistant colonies were extracted and individually amplified by colony PCR. Subsequently, unbalanced PCR using an excess of one primer with an overhang is used to generate the initiation toeholds. These DNA samples were allowed to react with our fluorescent probes. The probes were constructed by annealing four separate oligonucleotides, and possessed non-overlapping nicks that do not interfere with probe function. (c) The left side of each column shows the approximate position of the mutations, as determined by sequencing. The right side of each column shows the fluorescence response of the rpoB subsequences to the two fluorescent probes. A mutation in the green (blue) region would result in no increase in the fluorescence for Probe 1 (Probe 2), as shown in the green (blue) trace. The experimental results agree with the sequencing results in all experiments. The fluorescence data shown for the left experimental panels represents the behavior over 3 hours of reaction; the right panels show 10 hours of reaction. See Fig. S11–S15 for zoomed-in view of data.

References

    1. Gunderson KL, Steemers FJ, Lee G, Mendoza LG, Chee MS. A genome-wide scalable SNP genotyping assay using microarray technology. Nature Biotechnology. 2005;37:549–554. - PubMed
    1. Kim S, Misra A. SNP genotyping: technologies and biomedical applications. Annu. Rev. Biomed. Eng. 2007;9:289–320. - PubMed
    1. Arnold C, et al. Single-nucleotide polymorphism-based differentiation and drug resistance detection in Mycobacterium tuberculosis from isolates or directly from sputum. Clin. Microbiol. Infect. 2005;11:122–130. - PubMed
    1. Bang H, et al. Improved rapid molecular diagnosis of multidrug-resistant tuberculosis using a new reverse hybridization assay, REBA MTB-MDR. Journal of Medical Microbiology. 2011;60:1447–1454. - PMC - PubMed
    1. Schena M, Shalon D, Davis RW, Brown PO. Quantitative Monitoring of Gene Expression Patterns with a Complementary DNA Microarray. Science. 1995;270:467–470. - PubMed

Publication types