. 2013 Nov;3(11):1272-85.
doi: 10.1158/2159-8290.CD-13-0397. Epub 2013 Aug 21.

Autophagy sustains mitochondrial glutamine metabolism and growth of BrafV600E-driven lung tumors

Affiliations

Autophagy sustains mitochondrial glutamine metabolism and growth of BrafV600E-driven lung tumors

Anne M Strohecker et al. Cancer Discov. 2013 Nov.

Abstract

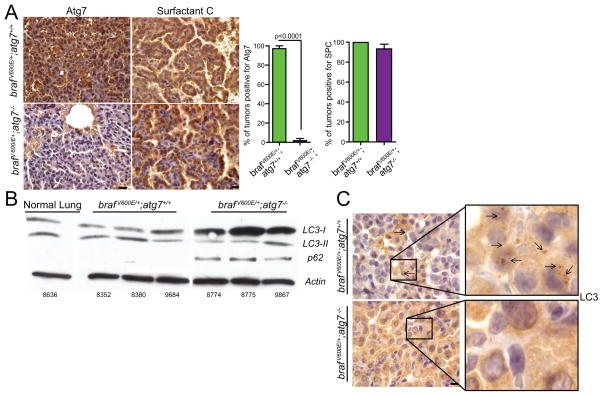
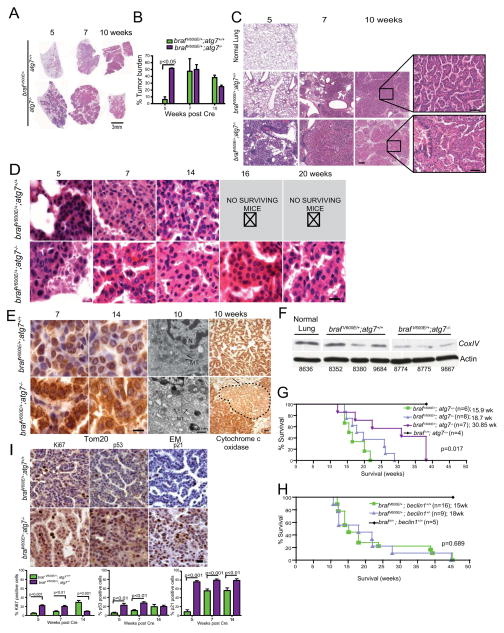
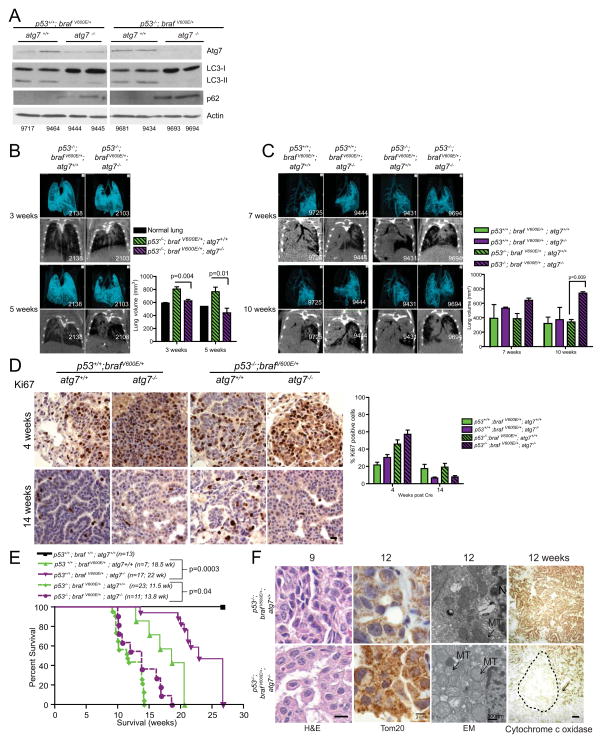
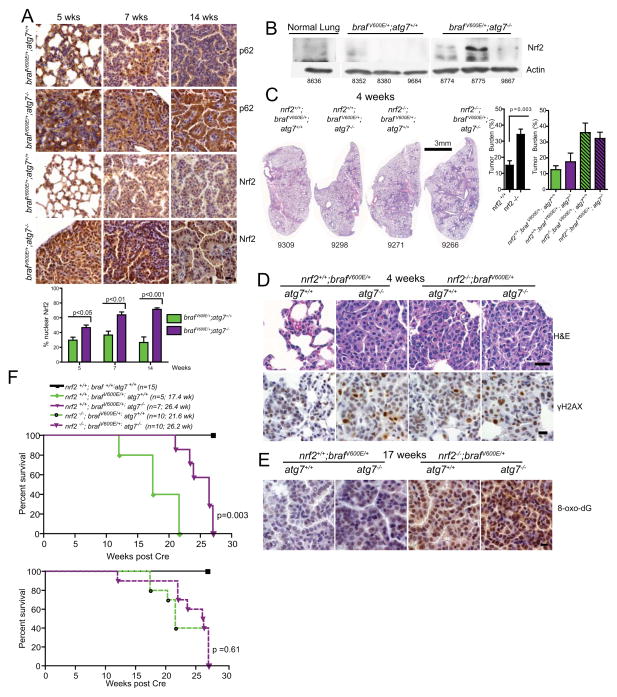
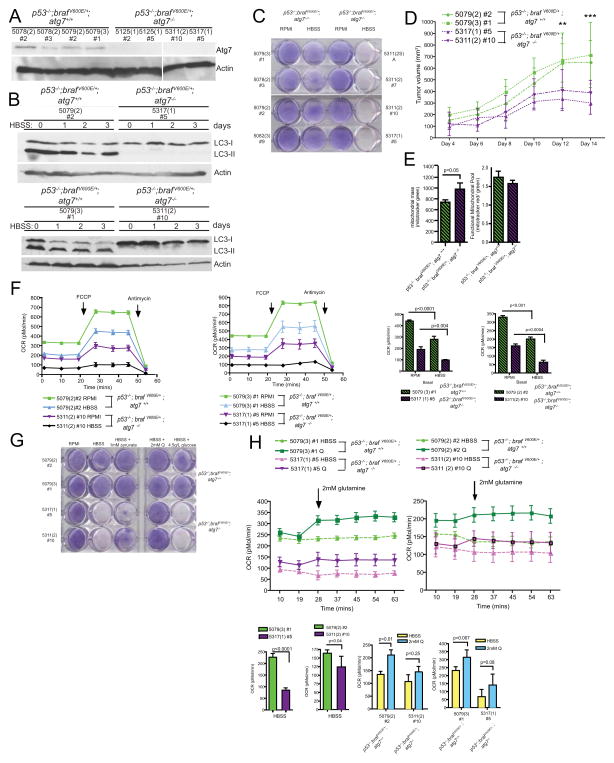
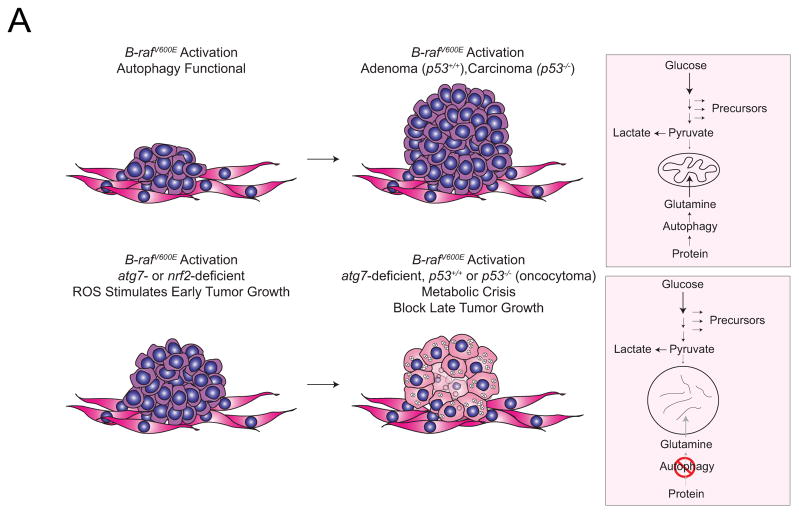
Autophagic elimination of defective mitochondria suppresses oxidative stress and preserves mitochondrial function. Here, the essential autophagy gene Atg7 was deleted in a mouse model of BrafV600E-induced lung cancer in the presence or absence of the tumor suppressor Trp53. Atg7 deletion initially induced oxidative stress and accelerated tumor cell proliferation in a manner indistinguishable from Nrf2 ablation. Compound deletion of Atg7 and Nrf2 had no additive effect, suggesting that both genes modulate tumorigenesis by regulating oxidative stress and revealing a potential mechanism of autophagy-mediated tumor suppression. At later stages of tumorigenesis, Atg7 deficiency resulted in an accumulation of defective mitochondria, proliferative defects, reduced tumor burden, conversion of adenomas and adenocarcinomas to oncocytomas, and increased mouse life span. Autophagy-defective tumor-derived cell lines were impaired in their ability to respire and survive starvation and were glutamine-dependent, suggesting that autophagy-supplied substrates from protein degradation sustains BrafV600E tumor growth and metabolism.

Significance: The essential autophagy gene Atg7 functions to promote BrafV600E-driven lung tumorigenesis by preserving mitochondrial glutamine metabolism. This suggests that inhibiting autophagy is a novel approach to treating BrafV600E-driven cancers.


Conflict of interest statement

The authors disclose no potential conflicts of interest

Figures

Figure 1
Figure 1. Atg7 deletion blocks autophagy in a mouse model of brafV600E–driven lung tumorigenesis
A. Representative IHC for ATG7 and Surfactant Protein C at 7 (BrafV600E/+; Atg7 +/+ and BrafV600E/+; Atg7−/−) post Cre. Quantification of these data is shown. IHC for ATG7 expression at late time points (20, 30 weeks) is provided in Figure S1. Scale bar= 10μm B. Western blot analysis of LC3-I to LC3-II conversion, and assessment of p62 accumulation in BrafV600E/+; Atg7 +/+ and BrafV600E/+; Atg7−/− tumor lysates 10 weeks post Cre. Numbers refer to individual mice. A blank lane was intentionally included between the normal lung and tumor lysates. An additional Atg7 null tumor lysate was spliced out for aesthetic reasons. C. Representative IHC staining of LC3 puncta in BrafV600E/+; Atg7 +/+ and BrafV600E/+; Atg7 −/− tumors 8 weeks post infection. Scale bar= 10μm. Arrows denote puncta. Note the absence of puncta and accumulation of diffuse staining in the Atg7 null tumors.
Figure 2
Figure 2. Atg7 deficiency has distinct consequences for tumor establishment and maintenance in BrafV600E–driven lung tumors and is associated with the emergence of oncocytomas and failure of mitochondrial function
A. Representative H&E staining of lung lobes at the indicated times post Cre. Scale bar= 3mm. Scanned H&E slides of the full time course are provided in Figure S2. B. Quantification of tumor burden (two mice/group, all lobes analyzed) from H&E slides across the indicated time points via Matlab. Error bars indicate SEM. Scanned H&E slides of the full time course are provided in Figure S2. C. Representative low power images of H&E slides 5, 7, 14 weeks post Cre. Scale bar= 100 μm. Higher magnification images are provided in the inset. Scale bar= 50 μm. D. Representative high magnification images of H&E staining of tumor for the indicated time course. Note the increasing large cytoplasm in the Braf V600E/+; Atg7−/− tumors indicative of oncocytoma. Scale bar=10 μm E. Braf V600E/+; Atg7−/− tumors have an accumulation of defective mitochondria. Representative images of Tom20 IHC, electron micrographs, and the enzymatic cytochrome c oxidase assay at the indicated time post Cre. For Tom20, Scale bar= 10μm. For EM, N=nucleus MT= mitochondria. Scale bar=500 nm. Arrows point to swollen mitochondria in Braf V600E/+; Atg7−/− tumors. For cytochrome c oxidase, arrows point to tumor regions, indicated by dashed line, with defective mitochondria in the Braf V600E/+; Atg7−/− tumors. Scale bar =100 μm. F. Western blot of Cox-IV in tumor lysates of Braf V600E/+; Atg7+/+ and Braf V600E/+; Atg7−/− mice 10 weeks post Cre. Numbers refer to individual mice. A blank lane was intentionally included between the normal lung and tumor lysates. An additional Atg7 null tumor lysate was spliced out for aesthetic reasons. G. Kaplan Meier analysis of overall survival of Braf V600E/+; Atg7+/+ and Braf V600E/+; Atg7−/− mice post Cre. Numbers of animals per group and median survival are indicated. H. Kaplan Meier analysis of overall survival of Braf V600E/+; Beclin1+/+ and Braf V600E/+; Beclin1+/− mice post Cre. Numbers of animals per group and median survival are indicated. I. Representative IHC of Ki67, p53 and p21 from Braf V600E/+; Atg7+/+ and Braf V600E/+; Atg7−/− mice 14 weeks post Cre. Scale bar=10 μm. Quantification of IHC at 5, 7, 14 weeks post Cre is shown below. Images for entire time course are provided in Figure S4.
Figure 3
Figure 3. Loss of p53 does not ablate the increased early tumorigenesis or life span extension of mice carrying Braf V600E/+; Atg7−/− tumors
A. Western blot analysis of ATG7 expression, LC3-I to LC3-II conversion, and accumulation of p62 in tumor lysates from Trp53+/+; BrafV600E/+; Atg7+/+, Trp53+/+; BrafV600E/+; Atg7−/− and Trp53−/−; BrafV600E/+; Atg7+/+, Trp53−/−; BrafV600E/+; Atg7−/− 14 weeks post Cre. Numbers refer to individual mice. B. Representative micro-CT images and 3D reconstructions of Trp53−/−; BrafV600E/+; Atg7+/+ and Trp53−/−; BrafV600E/+; Atg7−/− tumors at 3 and 5 weeks post Cre demonstrating increased tumor in the Trp53−/−; BrafV600E/+; Atg7−/− mice at early time points. Numbers refer to individual mice. Quantification of normal lung volume is shown at right. C. Representative micro-CT images and 3D reconstructions of Trp53+/+; BrafV600E/+; Atg7+/+, Trp53+/+; BrafV600E/+; Atg7−/− and Trp53−/−; BrafV600E/+; Atg7+/+, Trp53−/−; BrafV600E/+; Atg7−/− tumors at 7 and 10 weeks post Cre demonstrating reduced tumor in the Trp53−/−; BrafV600E/+; Atg7−/− mice at late time points. Numbers refer to individual mice. Quantification of normal lung volume is shown at right. D. Representative images of Ki67 staining of Trp53+/+; BrafV600E/+; Atg7+/+, Trp53+/+; BrafV600E/+; Atg7−/− and Trp53−/−; BrafV600E/+; Atg7+/+, Trp53−/−; BrafV600E/+; Atg7−/− tumors at 4 and 14 weeks post Cre. Scale bar= 10 μm Quantification is shown at right. E. Kaplan Meier analysis of overall survival of Trp53+/+ and Trp53−/−; Braf V600E/+; Atg7+/+ and Braf V600E/+; Atg7−/− mice post Cre. Numbers of mice per group and median survival are indicated on graph. Note: this study was ended at 22 weeks once the p value was highly significant (p=0.0003). F. Representative images of histology (H&E), Tom20 IHC, electron micrographs, and the enzymatic cytochrome c oxidase assay at the indicated time post Cre. For H&E, Scale bar=10 μm For Tom20, Scale bar= 2 μm. For EM, N=nucleus MT= mitochondria. Scale bar=500 nm. Arrows point to swollen mitochondria in Trp53−/−; Braf V600E/+; Atg7−/− tumors. For cytochrome c oxidase, arrows point to tumor regions, indicated by dashed lines, with defective mitochondria in the Trp53−/−; Braf V600E/+; Atg7−/− tumors. Scale bar =100 μm
Figure 4
Figure 4. Loss of Nrf2 phenocopies Atg7 deletion and is associated with increased lifespan
A. Representative IHC staining for p62 and NRF2 in lung tumors of BrafV600E/+; Atg7+/+ and BrafV600E/+; Atg7 −/− mice at the indicated time post Cre. Scale bar=10 μm. Quantification is shown below. Error bars are SEM. B. Western blot analysis of NRF2 accumulation in lysates of tumors harvested from BrafV600E/+; Atg7 +/+ and BrafV600E/+; Atg7−/− mice 10 weeks post Cre. Numbers refer to individual animals. A blank lane was intentionally included between the normal lung and tumor lysates. An additional Atg7 null tumor lysate was spliced out for aesthetic reasons. C. H&E staining of single lung lobes showing dramatic increase in size and number of tumors in Nrf2−/− mice independent of autophagy status 4 weeks post Cre. Scale bar= 3 mm. Quantification of tumor burden shown at right. The Nrf2+/+ and Nrf2−/− graph is the aggregate of autophagy competent and deficient braf tumors. These data are plotted individually in the next graph. The difference in tumor burden between the Nrf2 −/−;Braf V600E/+; Atg7+/+ and Nrf2 −/−;Braf V600E/+; Atg7−/− mice is not statistically significant (p=0.63). The difference in tumor burden between the Nrf2 +/+;Braf V600E/+; Atg7+/+ and Nrf2 +/+;Braf V600E/+; Atg7−/− mice is not statistically significant in this experiment (p=0.49). Please refer to similar experiments in Figs. 2A–C, S3, and 3B. D. Representative images of H&E and IHC analysis of γ-H2AX 4 weeks post Cre. Scale bar=10μm E. Representative images of IHC for 8-oxo-dG 17 weeks post Cre. Scale bar= 10μm F. Kaplan Meier analysis of overall survival of the Nrf2; Braf; Atg7 compound mutant mice. The number of mice per group and median survival are indicated. Note that the increased survival between the Nrf2−/−;Braf V600E/+; Atg7+/+ and Nrf2 +/+;Braf V600E/+; Atg7+/+ mice just misses statistical significance (p= 0.06).
Figure 5
Figure 5. Loss of Atg7 impairs mitochondrial metabolism and survival during starvation
A. Western blot analysis of ATG7 expression in TDCLs isolated 9 weeks post Cre from Trp53−/−; BrafV600E/+; Atg7 +/+ or Trp53−/−; BrafV600E/+; Atg7 −/− mice. Numbers refer to individual clones. An additional Atg7 null tumor lysate was spliced out for aesthetic reasons. B. Western blot analysis of conversion of LC3-I to LC3-II during a 3 day HBSS starvation time course. Numbers refer to individual clones. Two pairs of ATG7 wild type and ATG7 null derived TDCLs are shown. C. Clonogenic assay of autophagy-competent or -deficient TDCLs following 3 days of HBSS starvation and 4 day recovery in normal growth media. D. Allograft growth of Trp53−/−; BrafV600E/+; Atg7 −/− and Trp53−/−; BrafV600E/+; Atg7 +/+ TDCLs. n=8 tumors from each genotype were monitored. E. FACS analysis of Total Mitochrondrial Mass and Relative Mitochondrial Membrane Potential (MMP) of TDCLs. F. Seahorse measurement of basal and reserve oxygen consumption rates (OCR) of autophagy-competent and -deficient TDCLs under normal growth conditions or following 4hr HBSS starvation. G. Clonogenic survival of TDCLs incubated with RPMI, HBSS, or HBSS supplemented with exogenous glutamine (2mM), sodium pyruvate (1mM) or glucose (4.5g/L) during 3 day HBSS starvation and 4 day recovery in normal growth media. H. Seahorse measurement of OCR in the TDCLs incubated with HBSS before and after the addition of 2mM glutamine (Q). Injection timing is indicated by arrow.
Figure 6
Figure 6. Role of Atg7 in the growth of BrafV600E-driven lung tumors
See text for details.

Comment in

References

    1. White E. Deconvoluting the context-dependent role for autophagy in cancer. Nat Rev Cancer. 2012;12:401–10. - PMC - PubMed
    1. Qu X, Yu J, Bhagat G, Furuya N, Hibshoosh H, Troxel A, et al. Promotion of tumorigenesis by heterozygous disruption of the beclin 1 autophagy gene. J Clin Invest. 2003;112:1809–20. - PMC - PubMed
    1. Takamura A, Komatsu M, Hara T, Sakamoto A, Kishi C, Waguri S, et al. Autophagy-deficient mice develop multiple liver tumors. Genes & development. 2011;25:795–800. - PMC - PubMed
    1. Yue Z, Jin S, Yang C, Levine AJ, Heintz N. Beclin 1, an autophagy gene essential for early embryonic development, is a haploinsufficient tumor suppressor. Proc Natl Acad Sci U S A. 2003;100:15077–82. - PMC - PubMed
    1. Degenhardt K, Mathew R, Beaudoin B, Bray K, Anderson D, Chen G, et al. Autophagy promotes tumor cell survival and restricts necrosis, inflammation, and tumorigenesis. Cancer cell. 2006;10:51–64. - PMC - PubMed

Publication types

MeSH terms