. 2013 Oct 4;288(40):28831-44.
doi: 10.1074/jbc.M113.464776. Epub 2013 Aug 21.

Recruitment of a cytoplasmic chaperone relay by the A2A adenosine receptor

Affiliations

Recruitment of a cytoplasmic chaperone relay by the A2A adenosine receptor

Christian Bergmayr et al. J Biol Chem. .

Abstract

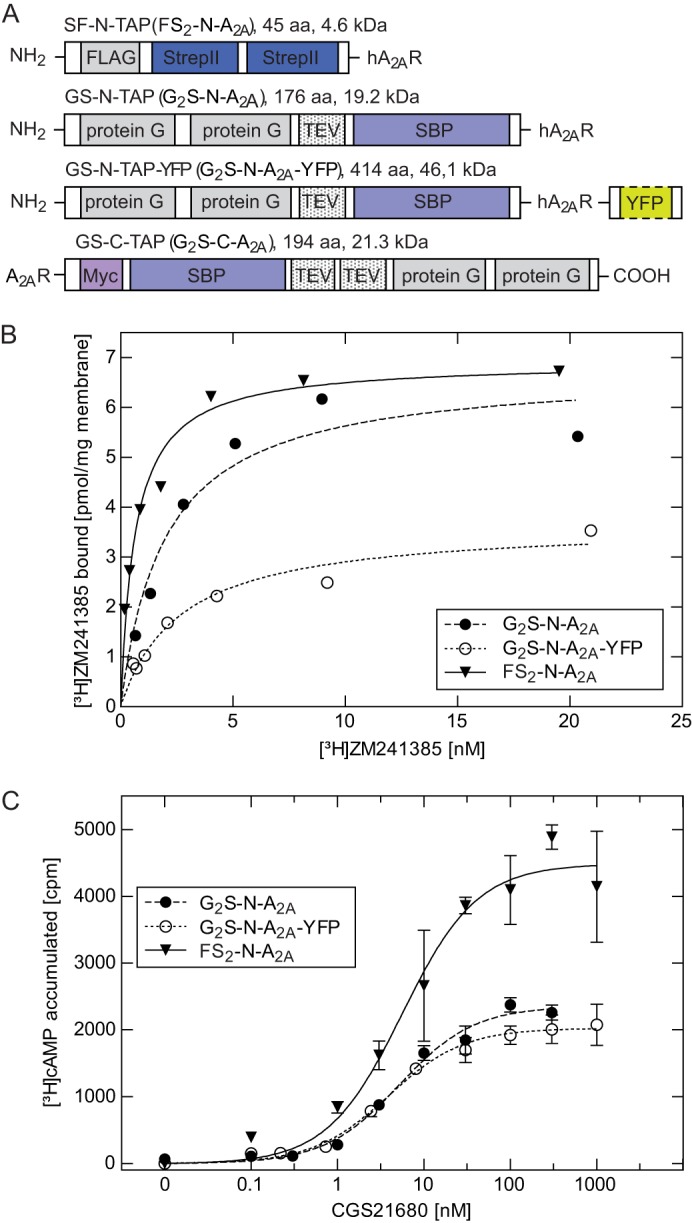
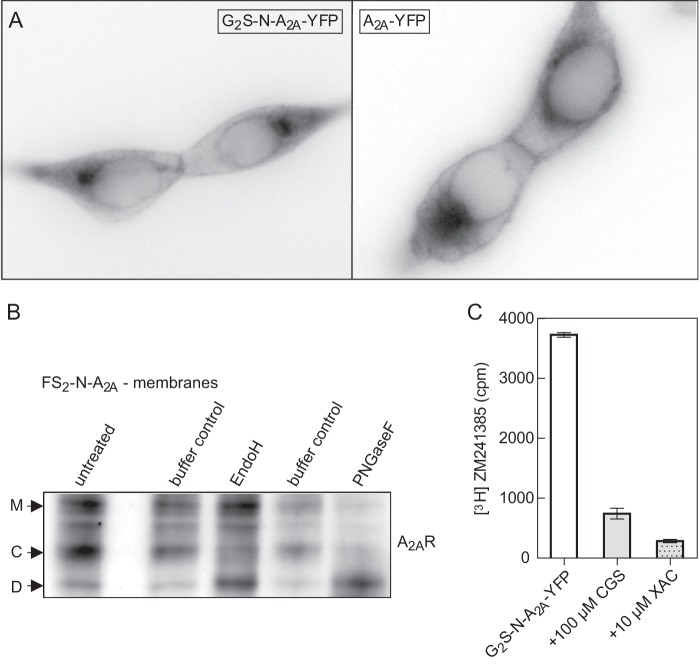
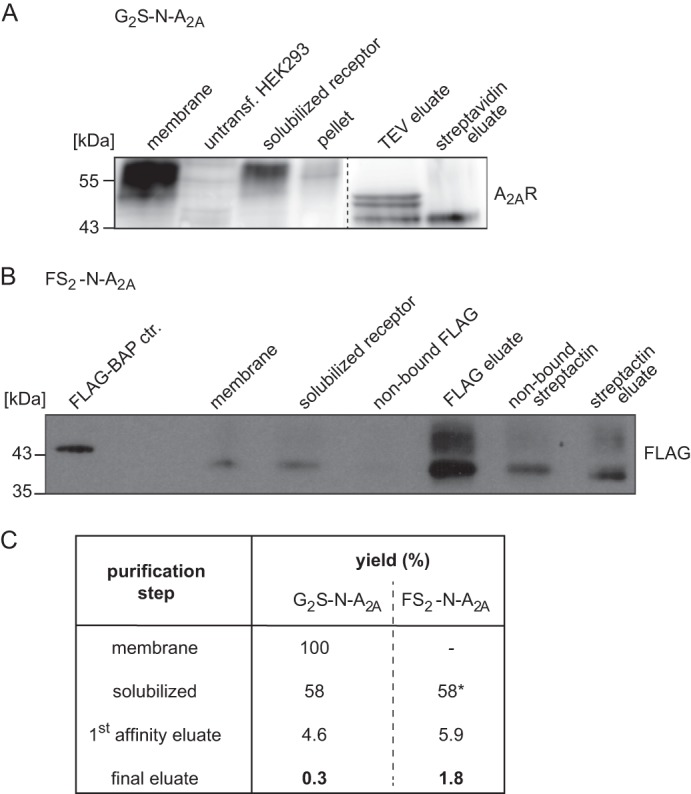
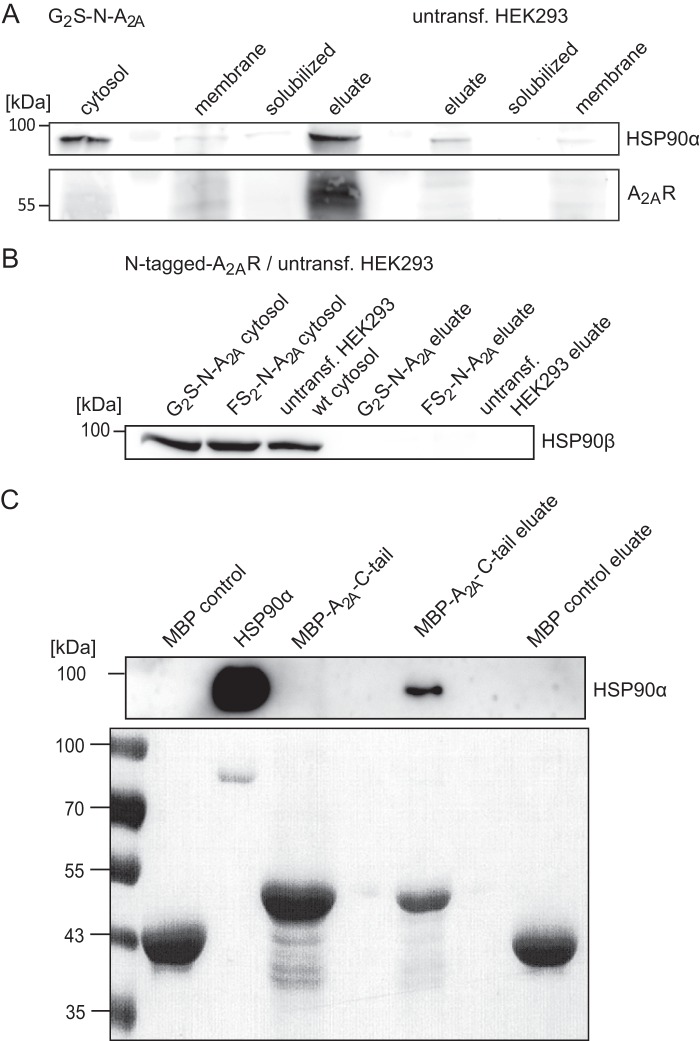
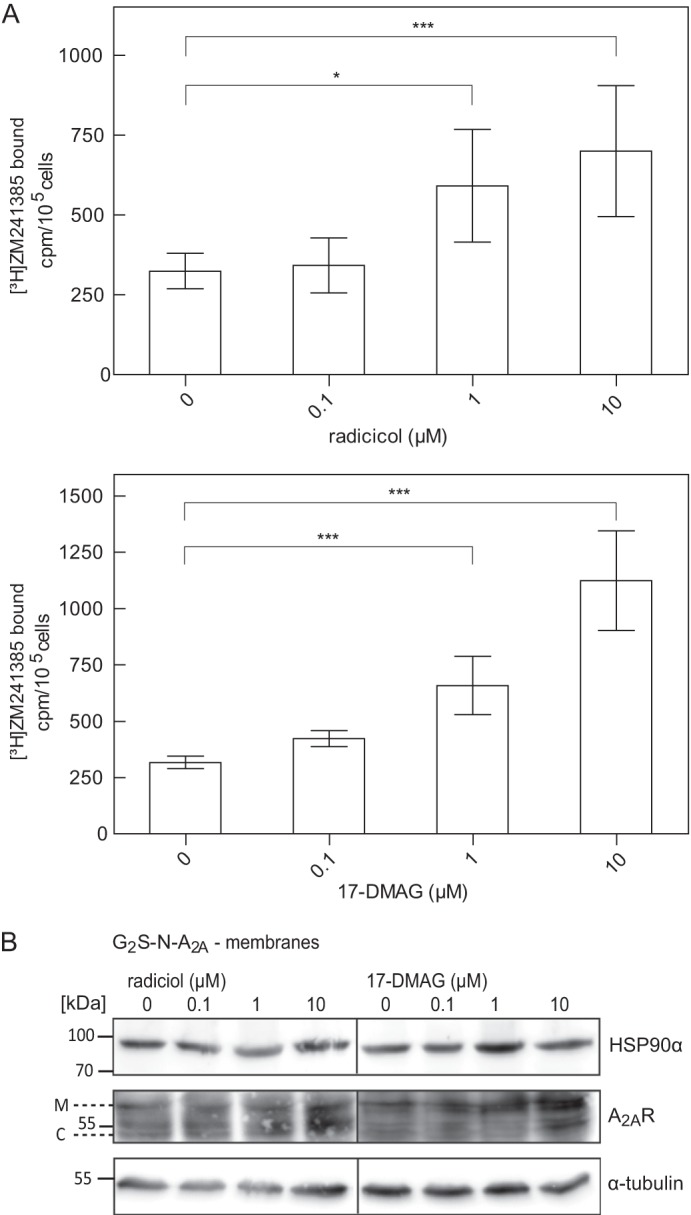
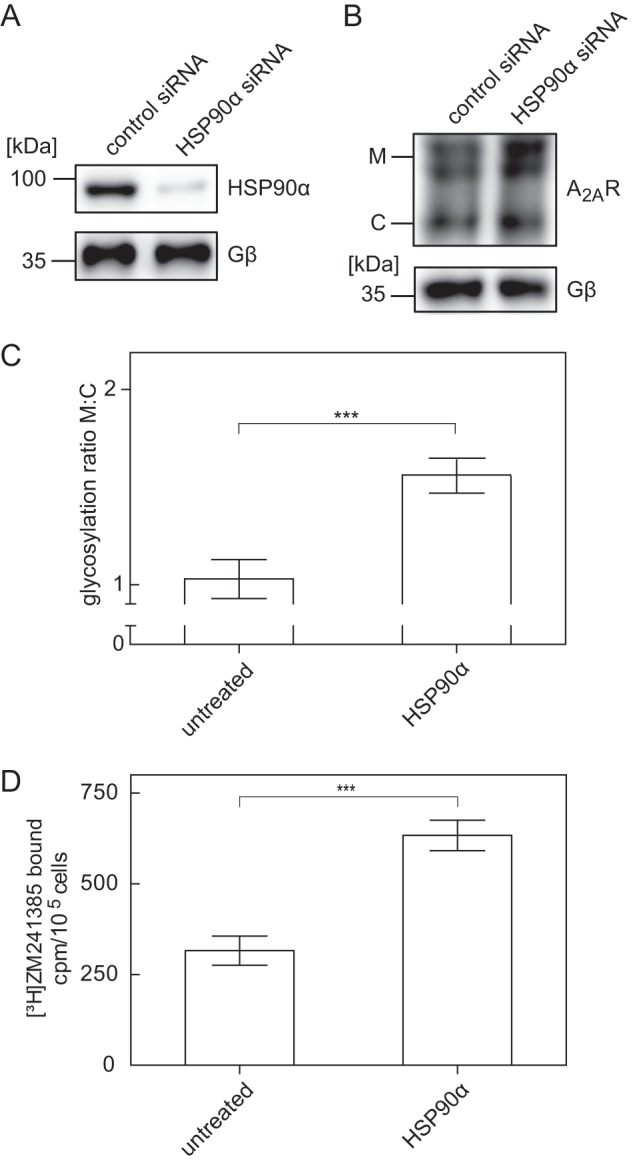
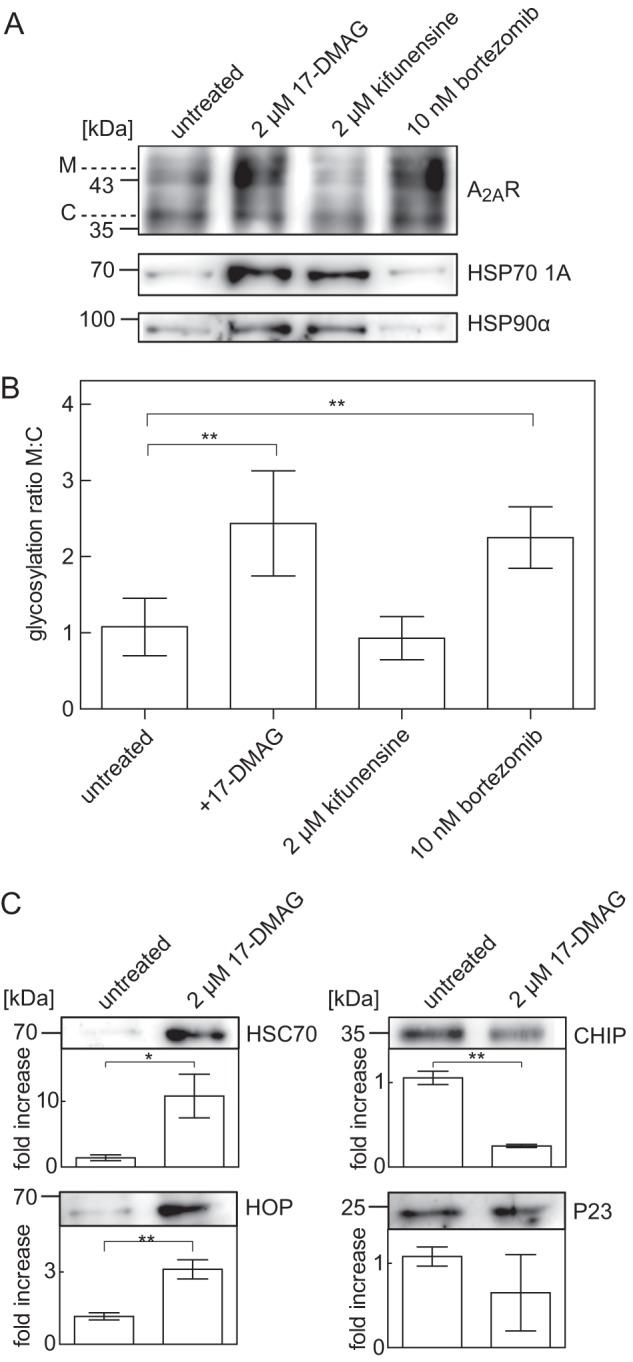
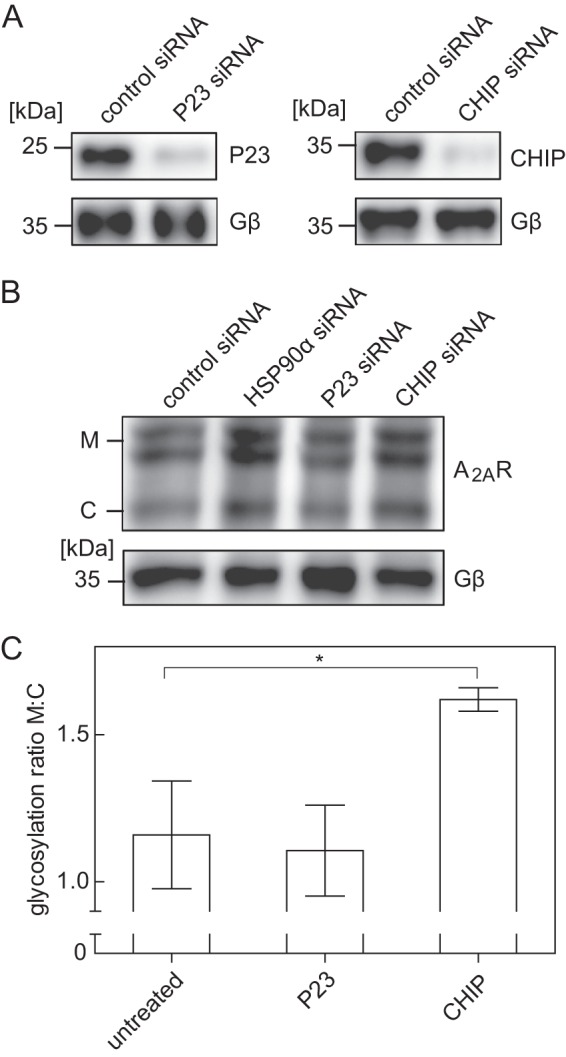
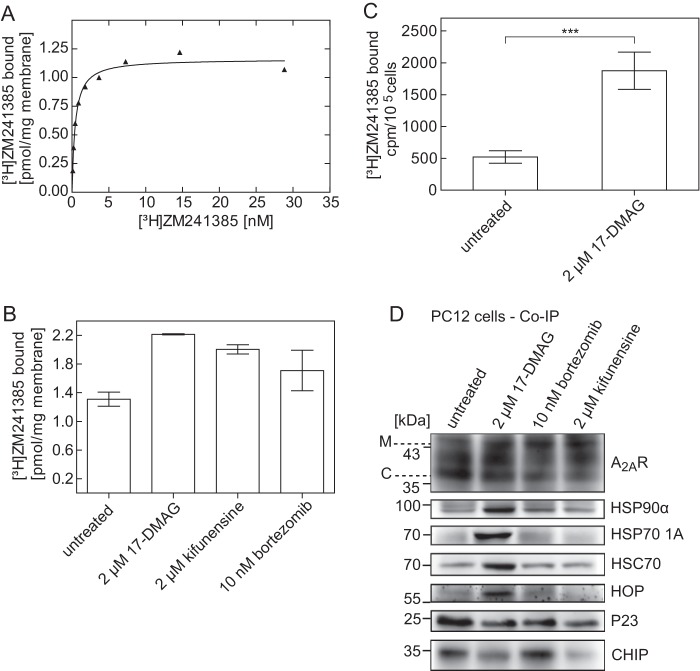
The adenosine A2A receptor is a prototypical rhodopsin-like G protein-coupled receptor but has several unique structural features, in particular a long C terminus (of >120 residues) devoid of a palmitoylation site. It is known to interact with several accessory proteins other than those canonically involved in signaling. However, it is evident that many more proteins must interact with the A2A receptor, if the trafficking trajectory of the receptor is taken into account from its site of synthesis in the endoplasmic reticulum (ER) to its disposal by the lysosome. Affinity-tagged versions of the A2A receptor were expressed in HEK293 cells to identify interacting partners residing in the ER by a proteomics approach based on tandem affinity purification. The receptor-protein complexes were purified in quantities sufficient for analysis by mass spectrometry. We identified molecular chaperones (heat-shock proteins HSP90α and HSP70-1A) that interact with and retain partially folded A2A receptor prior to ER exit. Complex formation between the A2A receptor and HSP90α (but not HSP90β) and HSP70-1A was confirmed by co-affinity precipitation. HSP90 inhibitors also enhanced surface expression of the receptor in PC12 cells, which endogenously express the A2A receptor. Finally, proteins of the HSP relay machinery (e.g. HOP/HSC70-HSP90 organizing protein and P23/HSP90 co-chaperone) were recovered in complexes with the A2A receptor. These observations are consistent with the proposed chaperone/coat protein complex II exchange model. This posits that cytosolic HSP proteins are sequentially recruited to folding intermediates of the A2A receptor. Release of HSP90 is required prior to recruitment of coat protein complex II components. This prevents premature ER export of partially folded receptors.

Keywords: 7-Helix Receptor; Adenosine Receptor; Adenylate Cyclase (Adenylyl Cyclase); Endoplasmic Reticulum (ER); G Protein-coupled Receptors (GPCR); G Proteins; Heat-Shock Protein.


Figures

FIGURE 1.
FIGURE 1.
Expression of N-terminally tagged A2A receptor constructs in HEK293 cells. A, schematic representation of the differently tagged receptors employed; G2S-N-TAP (total size 176 amino acids, 19.2 kDa) and the G2S-C-TAP (194 amino acids, 21.3 kDa) contain two protein G moieties and a streptavidin binding protein (SBP) fused to the N terminus and C terminus, respectively. G2S-N-TAP-A2AR-YFP contains, in addition, a YFP moiety at the C terminus. FS2-N-TAP (45 amino acids, 4.6 kDa) contains a FLAG-epitope and two Strep-Tactin moieties at the N terminus of the receptor. B, membranes (5–10 μg/assay) prepared from HEK293 cells stably expressing the indicated receptor (G2S-N- A2AR, G2S-N-TAP-A2AR-YFP, and FS2-N-A2AR) were incubated with increasing concentrations of the antagonist radioligand [3H]ZM241385. Data are means from duplicate determinations in a representative experiment. Two additional clones per construct were characterized. C, HEK293 cells (4 × 10⁵) stably expressing the indicated receptor (G2S-N-A2AR, G2S-N-TAP-A2AR-YFP, and FS2-N-A2AR) were incubated with [3H]adenine to metabolically label their adenine nucleotide pool. Accumulation of [3H]cAMP was measured after stimulation with the indicated concentrations of CGS21680. Data are means ± S.D. (error bars) from three independent experiments. One representative clone per construct is shown.
FIGURE 2.
FIGURE 2.
Localization of tagged A2A receptors in HEK293 cells. A, epifluorescence microscopy images of G2S-N-A2AR-YFP fusion protein (left) and A2AR-YFP (right), transiently expressed in HEK293 cells. B, representative deglycosylation experiment showing differently glycosylated species of the A2A receptor: mature (M), core-glycosylated (C), and deglycosylated (D). Volume-corrected aliquots (i.e. corresponding to 3 × 10⁵ cells) of HEK293 cell membranes stably expressing FS2-N-A2AR (n = 3) were incubated with either 2500 units of endoglycosidase H (EndoH; lane 3), 500 units of peptide:N-glycosidase F (PNGaseF; lane 5), or assay buffers only (lanes 2 and 4). Different A2AR glycoforms were compared with untreated cell membranes (lane 1). C, representative experiment to determine the location of ligand binding-competent A2A receptor. HEK293 cells stably expressing G2S-N-A2AR-YFP (2 × 10⁵ cells) were incubated with a 2 nm concentration of the membrane-permeable antagonist [3H]ZM241385 in the absence (white bar) and presence of the hydrophilic agonist CGS21680 (100 μm; gray bar) or the membrane-permeable antagonist XAC (10 μm; dotted bar) alone. Error bars, S.D.
FIGURE 3.
FIGURE 3.
Solubilization and purification of N-terminally tagged A2A receptors. A, purification of G2S-N-A2AR stably expressed in HEK293 cells (lane 1) was carried out in comparison with untransfected HEK293 cells (lane 2). They were monitored by Western blot (anti-A2AR) and CCD image analysis. The amount of solubilized G2S-N-A2AR is shown in lane 3, and the insoluble pellet is shown in lane 4 (both in equivalent volumes corresponding to 25 μg of original membranes). Lanes 5 and 6 represent the TEV eluate (equivalent to 10 times the original volume) and streptavidin eluate (equivalent to 100 times the original volume). B, aliquots at crucial steps of FS2-N-A2AR purification (corresponding to 32 μg of original membrane protein) (lanes 2–7, membranes, solubilized receptor, non-bound FLAG-agarose supernatant, FLAG eluate, non-bound Strep-Tactin supernatant, and final Strep-Tactin eluate, respectively) and 10 ng of FLAG-BAP control (lane 1) were quantified using scanned Western blot images (anti-FLAG). C, the yields of recovered protein complexes of typical N-tagged-A2AR purifications were calculated from pixel intensities of the respective bands, corrected for the volumes, and normalized to isolated membrane (100%, G2S-N) or solubilized aliquot (58%, FS2-N), respectively.
FIGURE 4.
FIGURE 4.
Co-affinity precipitation of N-terminally tagged A2A receptor and HSP90. Membranes and a cytosolic fraction were prepared from cells stably expressing the tagged version of the A2A receptor G2S-N-A2AR and from untransfected HEK293 cells. Membranes were solubilized with DDM, and the soluble extract was mixed with streptavidin beads. After three washes, bound proteins were released by heat denaturation in reducing sample buffer. Volume-corrected aliquots (i.e. corresponding to 2.5 × 10⁵ cells) of the cytosolic fraction, the membrane fraction, the solubilized material, and the final eluate were resolved by denaturing electrophoresis and immunoblotted for HSP90α (A, top), HSP90β (B), and the A2A receptor (bottom; visualized with the anti-A2A receptor). C, maltose-binding protein (MBP control) or MBP-A2A-C-tail fusion protein was incubated with recombinant HSP90α and bound to amylose resin. After two washes, bound proteins were released by heat denaturation in reducing sample buffer. Volume-corrected aliquots (50% of the original reaction) were immunoblotted for HSP90α (C, top). The proteins were also visualized by Ponceau staining of the nitrocellulose membrane to document the amount of MBP employed as input and recovered in the eluate (C, bottom).
FIGURE 5.
FIGURE 5.
Effect of HSP90 inhibitor treatment in total and surface levels of N-terminally tagged A2A receptors. A, HEK293 cells stably expressing the tagged receptor FS2-N-A2AR (2 × 10⁵ cells) were incubated with increasing concentrations of the HSP90 inhibitor radiciol or 17-DMAG for 24 h, followed by a 30-min incubation with the radioligand [3H]ZM241385 (1 nm) in the absence and presence of 10 μm XAC. After two washes, surface-bound antagonist was released by acid strip to determine the level of receptors at the cell surface. Error bars, S.D. Data are from four independent experiments done in triplicate. Statistical significance was calculated by analysis of variance followed by Dunnett's multiple-comparison post hoc test (*, p < 0.05; ***, p < 0.001). B, HEK293 cells stably expressing the tagged version G2S-N-A2AR were incubated with increasing concentrations of radicicol or 17-DMAG. After 24 h, cell membranes were prepared, and aliquots (corresponding to 2.5 × 10⁵ cells) were resolved by denaturing electrophoresis and immunoblotted for HSP90α (top), the A2A receptor (middle), and α-tubulin (bottom; loading control).
FIGURE 6.
FIGURE 6.
Increase in total and surface levels of an N-terminally tagged A2A receptor after siRNA-induced depletion of HSP90α. A, HEK293 cells stably expressing the FS2-N-A2A receptor were transfected with either negative control siRNA or siRNA targeting HSP90α. After 48 h, cells were lysed. Aliquots of the lysates were immunoblotted for HSP90α (A, top), A2A receptor (B, top), or G protein β-subunits (Gβ, lower blot as loading control in A and B). C, immunoblots done as in B, top, were analyzed with ImageJ. The ratio of mature (M) and core (C) glycosylated species was determined and normalized by setting the mean ratio observed in untreated control cells as 1. Data are means from three independent experiments; error bars, S.D. Statistical significance was assessed with a paired t test (***, p < 0.001). D, HEK293 cells stably expressing the FS2-N-A2A receptor (1.3 × 10⁵ cells) were transfected with either negative control siRNA or siRNA targeting HSP90α. After 48 h, cells were incubated with the radioligand [3H]ZM241385 (1 nm). Nonspecific binding was defined in the presence of 10 μm XAC. After two washes, surface-bound radioligand was released by acid strip and recovered in the supernatant. Data are means ± S.D. (n = 4); statistical significance was assessed with a paired t test (***, p < 0.001).
FIGURE 7.
FIGURE 7.
Formation of receptor-chaperone complexes in the absence and presence of inhibitors of HSP90, mannosidase, and the proteasome. A, HEK293 cells stably expressing the tagged receptor FS2-N-A2AR were incubated for 24 h in the absence (untreated; lane 1) or presence of 17-DMAG (2 μm; lane 2), kifunensine (2 μm, lane 3), or bortezomib (10 nm; lane 4). After membrane solubilization and immunoprecipitation, volume-corrected aliquots (i.e. corresponding to 2.5 × 10⁵ cells) of their co-affinity precipitation products were immunoblotted for A2A receptor (A, top), HSP70-1A (A, middle), and HSP90α (A, bottom). B, immunoblots done as in A (top) were analyzed with ImageJ. The ratio of mature (M) and core (C) glycosylated species was determined and normalized by setting the mean ratio observed in untreated control cells as 1. Data are means from four independent experiments; error bars, S.D. Statistical significance was assessed by analysis of variance (**, p < 0.01). C, the A2A receptor was immunoprecipitated from cells that had been incubated in the presence and absence of 17-DMAG (2 μm) as in A. The levels of HSC70 (C, top), HOP (C, second from top), P23 (C, third from top), and CHIP (C, bottom) were determined by immunoblotting and quantified with ImageJ. The pixel density of each band was determined and normalized by setting the mean density observed in untreated control cells as 1. Data are means from three independent experiments; error bars, S.D. Statistical significance was assessed by an unpaired t test (*, p < 0.05; **, p < 0.01).
FIGURE 8.
FIGURE 8.
Effect of siRNA-induced depletion of the co-chaperones P23 and CHIP on A2A receptor levels. A and B, HEK293 cells stably expressing the FS2-N-A2A receptor were transfected either with negative control siRNA or with siRNAs targeting P23, CHIP, and HSP90α (as an internal reference, compare Fig. 6). After 48 h, cells were lysed. Aliquots of the lysates were immunoblotted for P23 (A, top left), CHIP (A, top right), and A2A (B, top). G protein β-subunits (Gβ) were visualized as loading control (lower blots in A and B). C, immunoblots done as in B (top) were analyzed with ImageJ. The ratio of mature (M) and core (C) glycosylated species was determined and normalized by setting the mean ratio observed in untreated control cells as 1. Data are means from three independent experiments; error bars, S.D. Statistical significance was assessed by analysis of variance followed by Dunnett's multiple comparison post hoc test. *, p < 0.05.
FIGURE 9.
FIGURE 9.
Effect of HSP90 and/or proteasome inhibitors on the levels of endogenously expressed A2A receptor in PC12 cells. A, membranes (25–30 μg/assay) prepared from PC12 cells expressing the A2A receptor were incubated in buffer with the indicated concentrations of [3H]ZM241385 in the absence and presence of XAC (10 μm) to define nonspecific binding. This nonspecific binding was <20% at 10 nm radioligand and subtracted to generate the saturation hyperbola. B, prior to membrane preparations of PC12 cells expressing the A2A receptor, cells were incubated in the absence and presence of 17-DMAG (2 μm), kifunensine (2 μm), and bortezomib (10 nm). Membranes (25–30 μg/assay) were incubated with 10 nm [3H]ZM241385 in the absence and presence of 10 μm XAC to define nonspecific binding. C, PC12 cells endogenously expressing the A2A receptor (3.5 × 10⁵ cells) were incubated with increasing concentrations of 17-DMAG, followed by incubation with the radioligand [3H]ZM241385 (5 nm). Nonspecific binding was defined in the presence of 10 μm XAC. After two washes, surface-bound radioligand was released by an acid strip and recovered in the supernatant. Assays were performed in quadruplicates. Data are means ± S.D. from four independent experiments; statistical significance was assessed with a paired t test (***, p < 0.001). D, PC12 cells endogenously expressing the A2A receptor were incubated for 24 h in the absence (untreated; lane 1) or presence of 2 μm 17-DMAG (lane 2), 10 nm bortezomib (lane 3), or 2 μm kifunensine (lane 4). After membrane extraction and immunoprecipitation, aliquots (corresponding to 3 × 10⁵ cells) of the immunoprecipitate were blotted for the A2A receptor (top), HSP90α, HSP70–1A, HOP, P23, and CHIP, as indicated. M, mature; C, core glycosylated.

References

    1. Klinger M., Freissmuth M., Nanoff C. (2002) Adenosine receptors. G protein-mediated signalling and the role of accessory proteins. Cell. Signal. 14, 99–108 - PubMed
    1. Piersen C. E., True C. D., Wells J. N. (1994) A carboxyl-terminally truncated mutant and nonglycosylated A2A adenosine receptors retain ligand-binding. Mol. Pharmacol. 45, 861–870 - PubMed
    1. Klinger M., Kuhn M., Just H., Stefan E., Palmer T., Freissmuth M., Nanoff C. (2002) Removal of the carboxyl terminus of the A2A-adenosine receptor blunts constitutive activity. Differential effect on cAMP accumulation and MAP kinase stimulation. Naunyn Schmiedebergs Arch. Pharmacol. 366, 287–298 - PubMed
    1. Keuerleber S., Gsandtner I., Freissmuth M. (2011) From cradle to twilight. The carboxyl terminus directs the fate of the A2A-adenosine receptor. Biochim. Biophys. Acta 1808, 1350–1357 - PubMed
    1. Keuerleber S., Thurner P., Gruber C.W., Zezula J., Freissmuth M. (2012) Reengineering the collision coupling and diffusion mode of the A2A-adenosine receptor. Palmitolyation in helix 8 relieves confinement. J. Biol. Chem. 287, 42104–42118 - PMC - PubMed

Publication types

MeSH terms

Substances

LinkOut - more resources