

Mass spectrometry imaging, an emerging technology in neuropsychopharmacology
- PMID: 23966069
- PMCID: PMC3857656
- DOI: 10.1038/npp.2013.215
Mass spectrometry imaging, an emerging technology in neuropsychopharmacology
Abstract
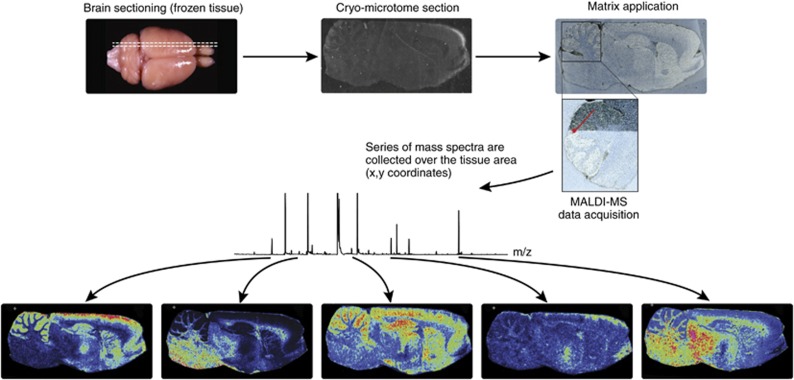
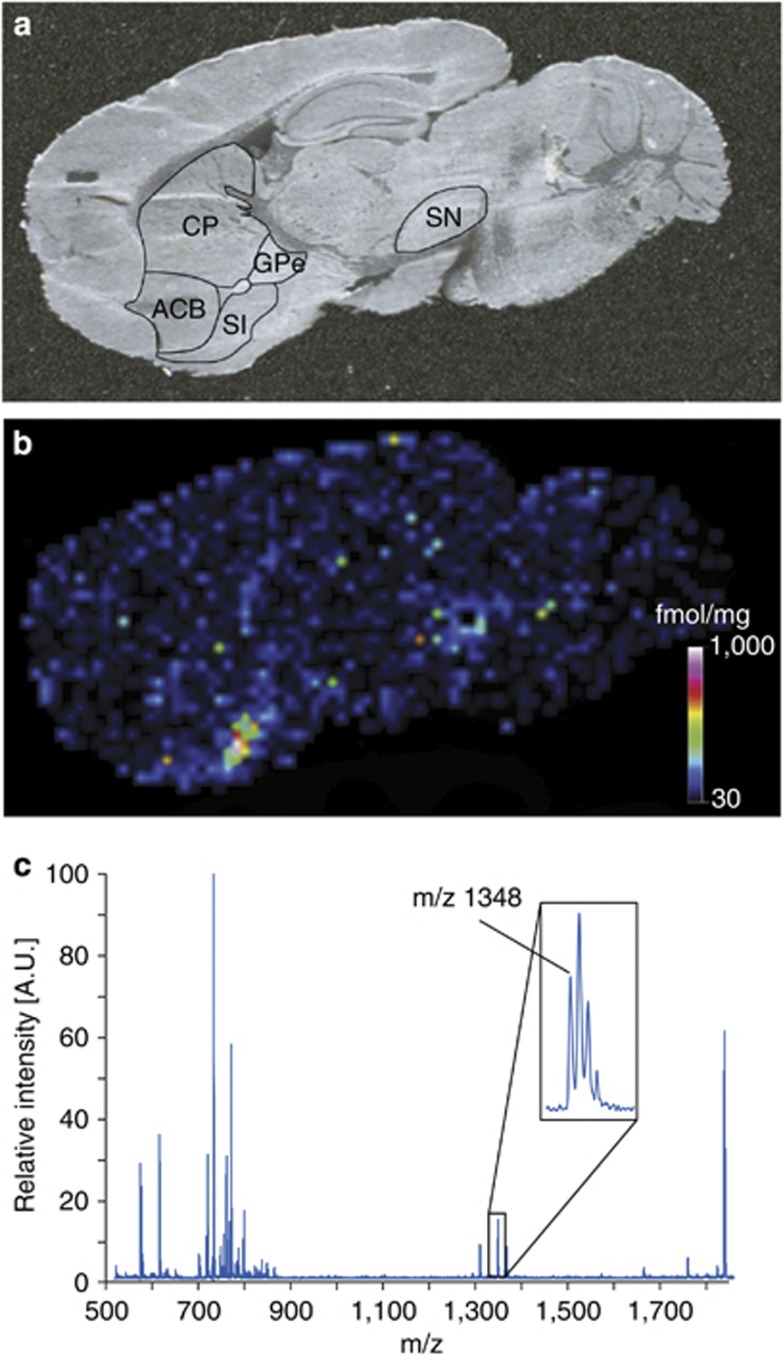
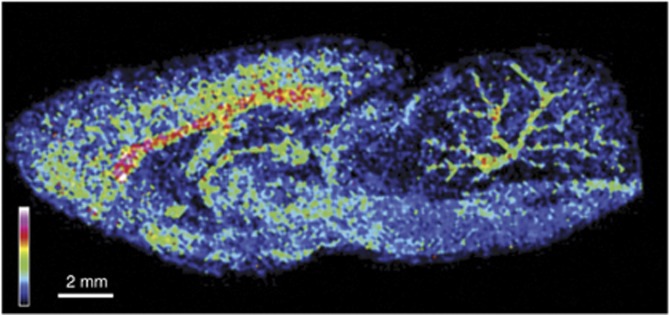
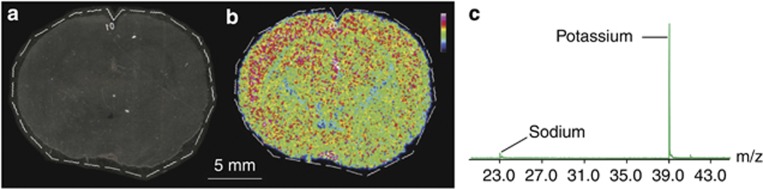
Mass spectrometry imaging is a powerful tool for directly determining the distribution of proteins, peptides, lipids, neurotransmitters, metabolites and drugs in neural tissue sections in situ. Molecule-specific imaging can be achieved using various ionization techniques that are suited to different applications but which all yield data with high mass accuracies and spatial resolutions. The ability to simultaneously obtain images showing the distributions of chemical species ranging from metal ions to macromolecules makes it possible to explore the chemical organization of a sample and to correlate the results obtained with specific anatomical features. The imaging of biomolecules has provided new insights into multiple neurological diseases, including Parkinson's and Alzheimer's disease. Mass spectrometry imaging can also be used in conjunction with other imaging techniques in order to identify correlations between changes in the distribution of important chemical species and other changes in the properties of the tissue. Here we review the applications of mass spectrometry imaging in neuroscience research and discuss its potential. The results presented demonstrate that mass spectrometry imaging is a useful experimental method with diverse applications in neuroscience.
Figures
Similar articles
-
Advances in spatial mass spectrometry enable in-depth neuropharmacodynamics.Trends Pharmacol Sci. 2022 Sep;43(9):740-753. doi: 10.1016/j.tips.2022.06.005. Epub 2022 Jul 5. Trends Pharmacol Sci. 2022. PMID: 35803758 Review.
-
Novel Trimodal MALDI Imaging Mass Spectrometry (IMS3) at 10 μm Reveals Spatial Lipid and Peptide Correlates Implicated in Aβ Plaque Pathology in Alzheimer's Disease.ACS Chem Neurosci. 2017 Dec 20;8(12):2778-2790. doi: 10.1021/acschemneuro.7b00314. Epub 2017 Oct 4. ACS Chem Neurosci. 2017. PMID: 28925253
-
[Mass spectrometry imaging technology and its application in breast cancer research].Se Pu. 2021 Jun;39(6):578-587. doi: 10.3724/SP.J.1123.2020.10005. Se Pu. 2021. PMID: 34227318 Free PMC article. Review. Chinese.
-
Mass spectrometry imaging of pharmacological compounds in tissue sections.Bioanalysis. 2010 Feb;2(2):279-93. doi: 10.4155/bio.09.180. Bioanalysis. 2010. PMID: 21083310 Review.
-
Molecular imaging mass spectrometry for probing protein dynamics in neurodegenerative disease pathology.J Neurochem. 2019 Nov;151(4):488-506. doi: 10.1111/jnc.14559. Epub 2018 Nov 6. J Neurochem. 2019. PMID: 30040875 Review.
Cited by
-
Spatial visualization of comprehensive brain neurotransmitter systems and neuroactive substances by selective in situ chemical derivatization mass spectrometry imaging.Nat Protoc. 2021 Jul;16(7):3298-3321. doi: 10.1038/s41596-021-00538-w. Epub 2021 Jun 2. Nat Protoc. 2021. PMID: 34075230
-
Recent advances in mass spectrometry analysis of neuropeptides.Mass Spectrom Rev. 2023 Mar;42(2):706-750. doi: 10.1002/mas.21734. Epub 2021 Sep 24. Mass Spectrom Rev. 2023. PMID: 34558119 Free PMC article. Review.
-
Pyrylium Salts as Reactive Matrices for MALDI-MS Imaging of Biologically Active Primary Amines.J Am Soc Mass Spectrom. 2015 Jun;26(6):934-9. doi: 10.1007/s13361-015-1119-9. Epub 2015 Mar 28. J Am Soc Mass Spectrom. 2015. PMID: 25821050
-
3D Imaging of Nanoparticle Distribution in Biological Tissue by Laser-Induced Breakdown Spectroscopy.Sci Rep. 2016 Jul 20;6:29936. doi: 10.1038/srep29936. Sci Rep. 2016. PMID: 27435424 Free PMC article.
-
Evaluation of the tumor-targeting efficiency and intratumor heterogeneity of anticancer drugs using quantitative mass spectrometry imaging.Theranostics. 2020 Feb 3;10(6):2621-2630. doi: 10.7150/thno.41763. eCollection 2020. Theranostics. 2020. PMID: 32194824 Free PMC article.
References
-
- Ageta H, Asai S, Sugiura Y, Goto-Inoue N, Zaima N, Setou M. Layer-specific sulfatide localization in rat hippocampus middle molecular layer is revealed by nanoparticle-assisted laser desorption/ionization imaging mass spectrometry. Med Mol Morphol. 2009;42:16–23. - PubMed
-
- Astigarraga E, Barreda-Gomez G, Lombardero L, Fresnedo O, Castano F, Giralt MT, et al. Profiling and imaging of lipids on brain and liver tissue by matrix-assisted laser desorption/ionization mass spectrometry using 2-mercaptobenzothiazole as a matrix. Anal Chem. 2008;80:9105–9114. - PubMed
-
- Bayes A, Grant SG. Neuroproteomics: understanding the molecular organization and complexity of the brain. Nat Rev Neurosci. 2009;10:635–646. - PubMed
Publication types
MeSH terms
LinkOut - more resources
Full Text Sources
Other Literature Sources
